Figure 4.
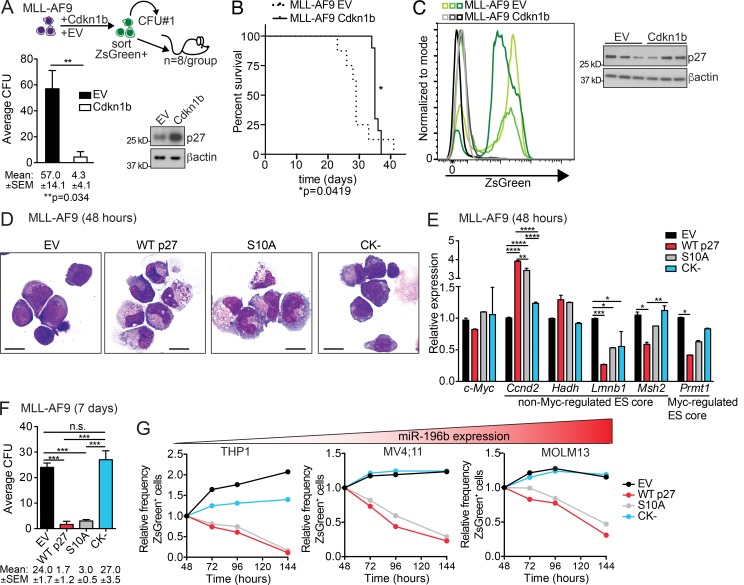
Cdkn1b/p27Kip1 suppresses MLL-r leukemia in a cyclin–CDK-dependent manner. (A) Top, schematic of CFU and transplantation of ZsGreen+ sorted Cdkn1b-ZsGreen (Cdkn1b) or EV-ZsGreen (EV) control expressing MLL-AF9 leukemia cells. Bottom, average number of colonies ± SEM (n = 3 replicates/group). Mean CFU numbers ± SEM indicated below bar graph. **, P ≤ 0.01 by t test. Immunoblot analyses of p27 performed on cells from CFU assays with β-actin as loading control. A representative of two independent experiments is shown with similar results. (B) Kaplan-Meier survival curve of mice transplanted with ZsGreen+ Cdkn1b overexpressing MLL-AF9 cells (n = 6/group). Significant differences in survival evaluated by Log-rank (Mantel-Cox) test; *, P ≤ 0.05. (C) Counter selection of p27 overexpression in vivo. Flow cytometric analyses for ZsGreen+ expression in EV (green lines) and Cdkn1b-overexpressing (black lines) MLL-AF9 leukemic splenocytes from moribund mice. Three representative mice/group are shown. Immunoblot analysis of p27 with β-actin as loading control (n = 3 mice/group). (D–F) Functional dissection of p27 activity. WT p27Kip1 (WT p27), nuclear localized p27Kip1 (S10A; increased cell cycle inhibition), or CDK-binding domain mutant p27Kip1 (CK−; no cell cycle inhibition) were expressed via lentiviral vectors in murine MLL-AF9 leukemic splenocytes. EV vector served as control. Cells were FACS sorted for ZsGreen+ 48 h after transduction and prepared for cytospin (D), RNA (E), or plated in CFU assay (F). Representatives of two independent experiments with similar results is shown. (D) Cytologies of ZsGreen+ EV, WT p27, S10A, and CK− expressing MLL-AF9 cells were visualized with Wright Giemsa stain and imaged at 60× magnification. Bars, 10 µm. (E) RNA extracted from ZsGreen+ EV, WT p27, S10A, and CK− MLL-AF9 cells was examined by RT-qPCR for changes in c-Myc expression as well as representative non–Myc-regulated (Ccnd2, Hadh, Lmnb1, and Msh2) and ESC core genes (Prmt1; n = 2 replicates/group; from Fig. S3, K and L). Expression was compared with Sdha as loading control and is graphed as average relative to EV ± SEM. Statistical significance was evaluated for each gene by two-way ANOVA Holm-Sidak multiple comparisons test. (F) Equal numbers of ZsGreen+ EV, WT p27, S10A, and CK− expressing MLL-AF9 leukemic splenocytes were plated in triplicate in methylcellulose. The average number colonies ± SEM enumerated after 7 d in methylcellulose is shown for three technical replicates with mean CFU ± SEM indicated below. A representative of two independent experiments is shown. Statistical significance was evaluated by one-way ANOVA Holm-Sidak multiple comparisons test. *, P ≤ 0.05; **, P ≤ 0.01; ***, P ≤ 0.001; ****, P ≤ 0.0001. n.s., not significant. (G) Human AML cell lines are organized according to their levels of miR-196b expression (lowest to highest, red gradient triangle; see also Fig. S4 B). The relative frequency of ZsGreen+ EV, WT p27, S10A, or CK− transduced THP1, MV4;11, and MOLM13 cells measured over time are shown as relative to the proportion of ZsGreen+ cells at the initial time point 48 h post-transduction. A representative experiment is shown.

