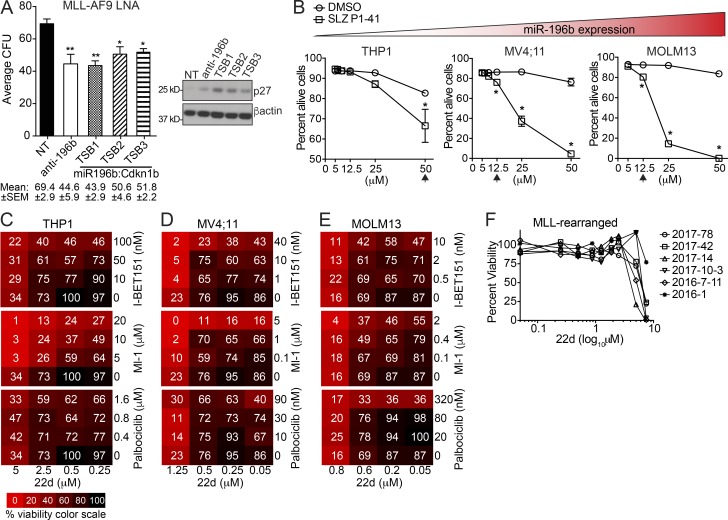
Figure 5.
RNAi disruption of miR-196b activity or pharmacologic inhibition of SCFSKP2 elevate p27Kip1 and inhibit human AML growth. (A) MLL-AF9 leukemic splenocytes were treated with indicated LNA and plated in triplicate for CFU assays. The sequences of the LNAs coded for a scramble nontargeting control (NT), homologous sequence to miR-196b-5p (anti-196b), or three variant target site–blocking (TSB1-3) LNAs designed with sequence homology to the Cdkn1b 3′UTR miR-196b target binding site (miR196b:Cdkn1b). CFU results are shown as the average number of colonies ± SEM for each LNA in two independent experiments (left), with mean CFU ± SEM indicated below. Statistical significance was evaluated by t test for anti-196b and TSB LNAs compared with NT control. Immunoblots for p27 (right) were performed on LNA-treated CFU to detect target engagement with β-actin as loading control. (B) Average ± SEM percentage of alive (AnnexinV−PI−) THP1, MV4;11, and MOLM13 human AML cells treated for 3 d in duplicate with the indicated amounts (μM) of SLZ P1-41 (squares) or equivalent volume of DMSO control (circles). Statistical significance was evaluated for each cell line by multiple unpaired t tests Holm-Sidak multiple testing correction. *, P ≤ 0.05; **, P < 0.01. Relative miR-196b expression indicated by triangular color scale (see also Fig. S4 B). (C–E) Cell viability heat maps of THP1 (C), MV4;11 (D), and MOLM13 (E) cells treated for 3 d with single drugs or combinations of 22d, IBET-151, Ml-1, or Palbociclib. Color scale is denoted in C. A representative of at least two experiments with similar results is shown for each. See Table S3 for analyses of drug synergies. (F) Primary human MLL-r AML patient samples (n = 6) were treated with increasing concentrations of 22d. Cell viability was measured by MTS for all doses after 3-d 22d treatment.

