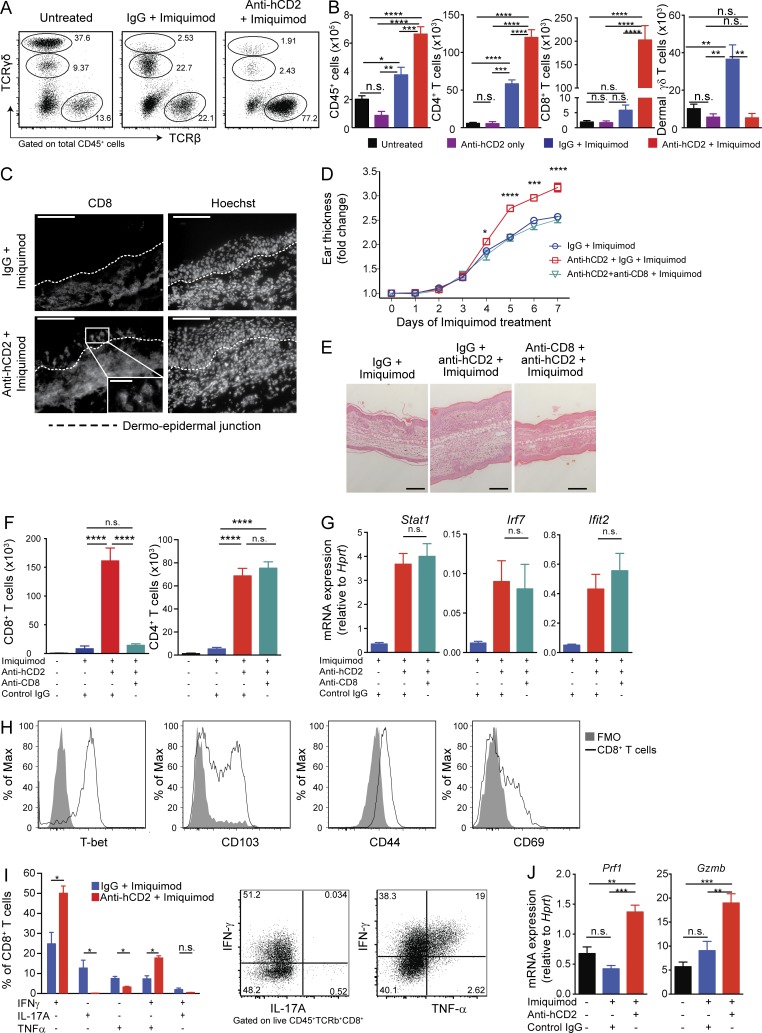
Figure 2.
CD8+ T cells are the driving effector population controlled by T reg cells in psoriasiform skin inflammation. (A and B) Flow cytometry analysis of T cell subsets in mouse ear skin. Frequency of TCRβ+, TCRγδint, and TCRγδhigh cells among total CD45+ cells (A) and absolute numbers of cells extracted from skin (B). (C) Representative immunofluorescence staining of CD8+ T cells in ear skin. Dashed lines indicate the dermo-epidermal junction. Scale bars, 100 µm; inset, 25 µm. (D) Thickness of ear skin over the course of IMQ treatment. (E) Representative H&E staining after 7 d of IMQ treatment. Scale bars, 200 µm. (F) Total CD8+ and CD4+ T cells extracted from skin, determined by flow cytometry. (G) qPCR analysis confirming mRNA levels of interferon response genes in IMQ-treated skin. (H) Flow cytometry analysis of CD8+ T cells isolated from anti-hCD2 + IMQ–treated ear skin. FMO, fluorescence minus one control. (I) Frequency of IFN-γ, IL-17A, and TNF-α expression by CD8+ T cells isolated from anti-hCD2 + IMQ– and IgG + IMQ–treated ear skin assessed by flow cytometry after stimulation (PMA/ionomycin for 4 h + BFA) and representative FACS plots for anti-hCD2 + IMQ–treated group. (J) qPCR analysis of FACS-sorted skin CD8+ T cells. Error bars: means ± SEM. Statistics: one-way (B, F, G, and J) and two-way ANOVA (D) with post-hoc test, Mann-Whitney U test (I). Data are representative of one of three (A–F and H) and one of two (F and I) experiments with n ≥ 2 (C and J) or n ≥ 3 mice per group (A, B, and D–I). *P = 0.01–0.05, **P = 0.001–0.01, ***P = 0.0001–0.001, ****P < 0.0001, n.s., not significant.

