Figure 4.
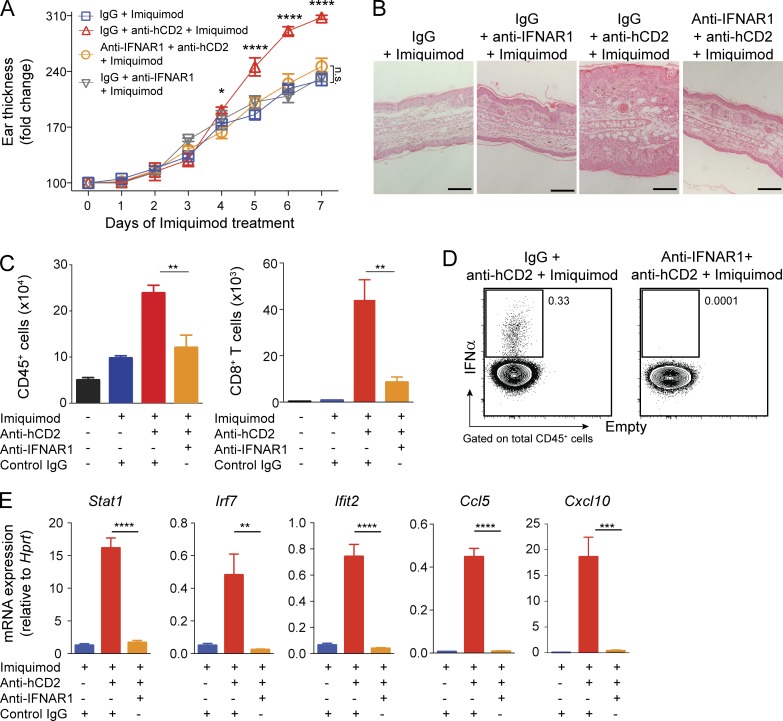
T reg cells control skin inflammation by inhibiting IFN-I production. (A–E) IFNAR1 blockade in mice treated with IMQ ± anti-hCD2. (A) Thickness of ear skin over the course of treatment. (B) Representative H&E-stained skin of treatment groups as indicated. Scale bars, 200 µm. (C) Quantification of total skin CD45+ cells and CD8+ T cells by flow cytometry. (D) Representative flow cytometry plot of total IFN-α+ cells in cervical lymph nodes at day 7 of IMQ treatment. (E) qPCR analysis of interferon response gene mRNA in skin tissue. Error bars: means ± SEM. Statistics: one-way (C and E) and two-way ANOVA (A) with post-hoc test. Data are representative of one of three experiments with n ≥ 4 (B and C) or one of two experiments with n ≥ 4 (A and E) or n ≥ 3 mice per group (D). *P = 0.01–0.05, **P = 0.001–0.01, ***P = 0.0001–0.001, ****P < 0.0001, n.s., not significant.

