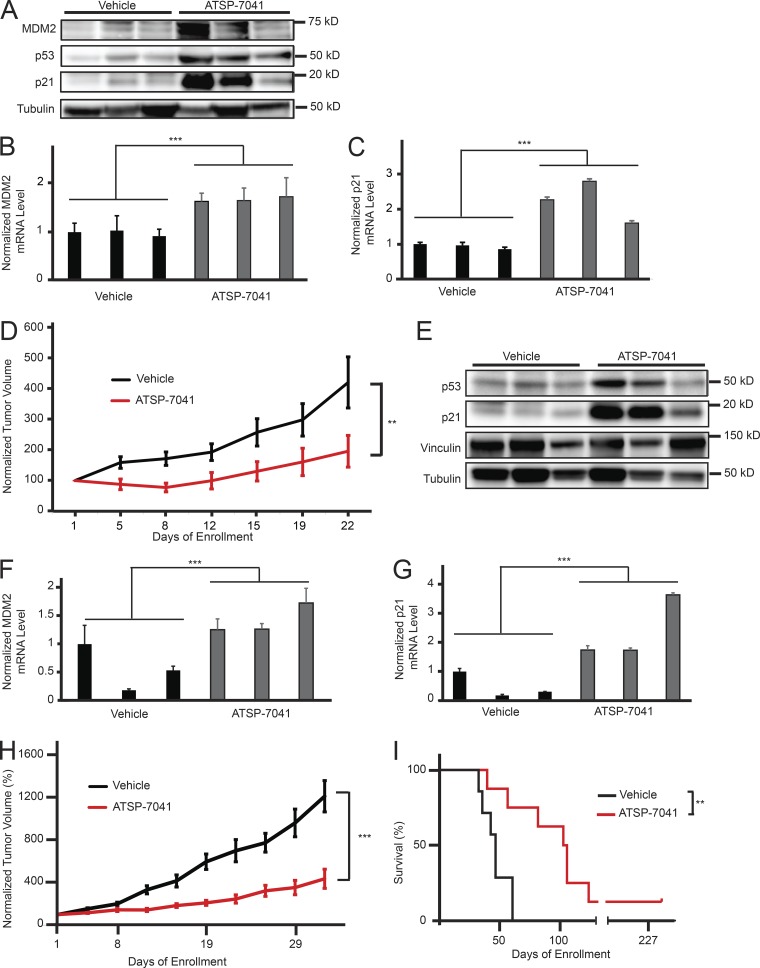
Figure 4.
ATSP-7041 shows anti-tumor efficacy in Ewing sarcoma models in vivo. (A) Western blot showing an increase of MDM2, p53, and p21 protein levels in TC32 xenograft tumor tissues after ATSP-7041 treatment in vivo. After tumor engraftment, mice were treated with three doses of 30 mg/kg q.o.d. ATSP-7041 or vehicle and sacrificed 8 h after the last dose. Each lane represents an individual mouse tumor. (B) Quantitative PCR showing comparative MDM2 mRNA levels with vehicle (black) or ATSP-7041 (gray) treatment of TC32 xenograft cells in vivo. Values were normalized to the first vehicle-treated sample. Each bar represents an individual mouse tumor; error bars represent standard deviation of three technical replicates. Significance was calculated by paired, two-tailed t test: ***, P ≤ 0.001. (C) Quantitative PCR showing comparative p21 mRNA levels with vehicle (black) or ATSP-7041 (gray) treatment of TC32 xenograft cells in vivo. Values were normalized to the first vehicle-treated sample. Each bar represents an individual mouse tumor; error bars represent standard deviation of three technical replicates. Significance was calculated by paired, two-tailed t test: ***, P ≤ 0.001. (D) Normalized average tumor volume from mice bearing TC32 xenograft tumors treated with 30 mg/kg ATSP-7041 q.o.d. (red, n = 8), or vehicle q.o.d. (black, n = 7). Mice were treated with 10 doses. Tumor volume from each mouse was normalized to the tumor volume at the day of enrollment. Error bars represent standard deviation. Significance was calculated by two-way ANOVA analysis: **, P ≤ 0.01. (E) Western blot showing an increase of MDM2, p53, and p21 protein levels in PDX tumor tissues after ATSP-7041 treatment in vivo. After tumor engraftment, mice were treated with three doses of 30 mg/kg q.o.d. ATSP-7041 or vehicle and sacrificed 8 h after the last dose. Each lane represents an individual mouse tumor. (F) Quantitative PCR showing comparative MDM2 mRNA levels with vehicle (black) or ATSP-7041 (gray) treatment of PDX cells in vivo. Values were normalized to the first vehicle-treated sample. Each bar represents an individual mouse tumor; error bars represent standard deviation of three technical replicates. Significance was calculated by paired, two-tailed t test: ***, P ≤ 0.001. (G) Quantitative PCR showing comparative p21 mRNA levels with vehicle (black) or ATSP-7041 (gray) treatment of PDX cells in vivo. Values were normalized to the first vehicle-treated sample. Each bar represents an individual mouse tumor; error bars represent standard deviation of three technical replicates. Significance was calculated by paired, two-tailed t test: ***, P ≤ 0.001. (H) Normalized average tumor volume from mice bearing PDX tumors treated with 30 mg/kg ATSP-7041 q.o.d. (red, n = 8), or vehicle q.o.d. (black, n = 7). Mice were treated with 10 doses. Tumor volume for each mouse was normalized to the tumor volume at the day of enrollment. Error bars represent standard deviation. Significance was calculated by two-way ANOVA analysis: ***, P ≤ 0.001. (I) Survival of mice bearing PDX tumors. One mouse treated with ATSP-7041 had complete tumor regression without recurrence over the observed time frame. Significance was calculated by Log-rank (Mantel-Cox) test: **, P ≤ 0.01.

