Figure 6.
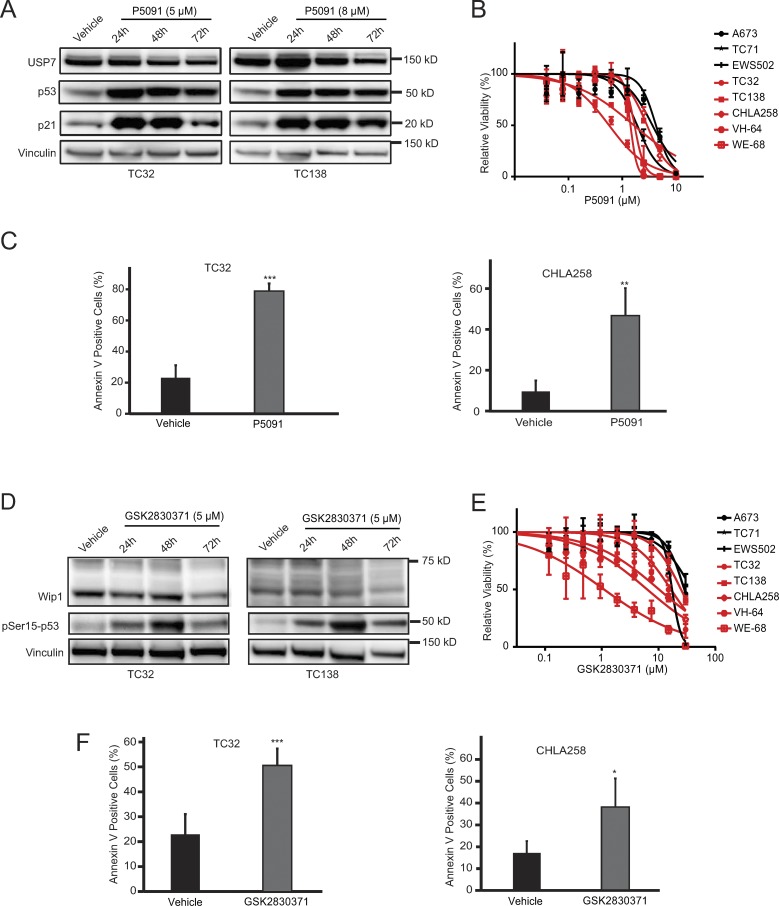
GSK2830371 and P5091 reduce viability and induce cell death in TP53 wild-type Ewing sarcoma cell lines. (A) Western blots showing increase in p53 and p21 protein levels with P5091 treatment in TP53 wild-type Ewing sarcoma cell lines. (B) Ewing sarcoma cells were treated with P5091 for 3 d. TP53 wild-type Ewing sarcoma cell lines are shown in red; TP53 mutant Ewing sarcoma cell lines are shown in black. Values were normalized to vehicle controls. Each data point shows the mean of eight replicates; error bars are mean values ± standard deviation. The experiment was performed twice and data points of one representative experiment are shown. (C) 2-d treatment with P5091 triggers cell death in TC32 (treated with 6.5 µM) and CHLA258 cells (treated with 8 µM) as measured by Annexin V staining. Data points represent the mean of five replicates of two experiments, and error bars are mean ± standard deviation. (D) Western blots showing decreased protein levels of Wip1 and increased pSer15-p53 upon GSK2830371 treatment at the indicated time and concentration. (E) Ewing sarcoma cells were treated with GSK2830371 for 3 d. TP53 wild-type Ewing sarcoma cell lines are shown in red. TP53 mutated Ewing sarcoma cell lines are shown in black. Values were normalized to vehicle controls. Each data point shows the mean of eight replicates; error bars are mean values ± standard deviation. The experiment was performed twice, and data points of one representative experiment are shown. (F) 3-d treatment with GSK2830371 triggers cell death in TC32 and CHLA258 (both treated with 15 µM) cell lines, as measured by Annexin V staining. Data points represent the mean of five replicates of two experiments, and error bars are mean values ± standard deviation. Significance was calculated by paired, two-tailed t test: *, P ≤ 0.05; **, P ≤ 0.01; ***, P ≤ 0.001.

