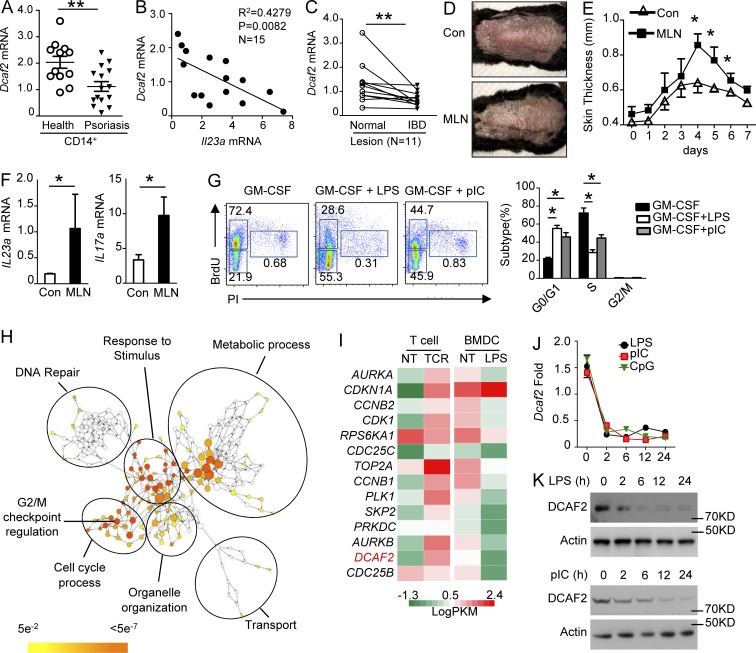
Figure 1.
TLRs restrict cell cycle processes and DCAF2 expression. (A) qPCR analysis of DCAF2 mRNA levels in CD14+ peripheral blood mononuclear cells (PBMCs) from healthy donors and psoriasis patients. (B) Correlation analysis of the DCAF2 mRNA expression with the critical pathogenic cytokine IL-23 in CD14+ PBMCs from psoriasis patients. (C) qRT-PCR analysis of DCAF2 transcripts in IBD inflammatory lesions and normal samples from the same patients (n = 11). (D–F) WT mice (n = 5/group) were i.p. injected with vehicle (Con) or MLN4924 (MLN) for three days before inducing the psoriasis model. (D) Representative photos taken on day 3 post-Aldara treatment. (E) Thickness of back skin lesions on day 4. (F) qRT-PCR analysis of cytokine expression in skin samples on day 5 post-Aldara treatment. (G) WT BMDCs were incubated with BrdU and triggered with GM-CSF plus LPS or pIC for 36 h. DNA synthesis was analyzed by FACS and used to assess the cell cycle. (H) Network visualization of gene ontology enrichment analysis of DEGs in BMDCs in response to LPS for 6 h. (I) Heat map showing G2/M transition–related gene expression in BMDCs activated by LPS for 6 h or T cells stimulated with αCD3/αCD28 for 18 h. (J and K) BMDCs were stimulated with LPS, pIC, or CpG2216 for the indicated time points. DCAF2 expression was monitored by qRT-PCR (J) and immunoblotting (K). All data are representative of three independent experiments. Error bars show the mean ± SEM. Significance was determined by two-tailed Student’s t test. *, P < 0.05; **, P < 0.01.

