Figure 3.
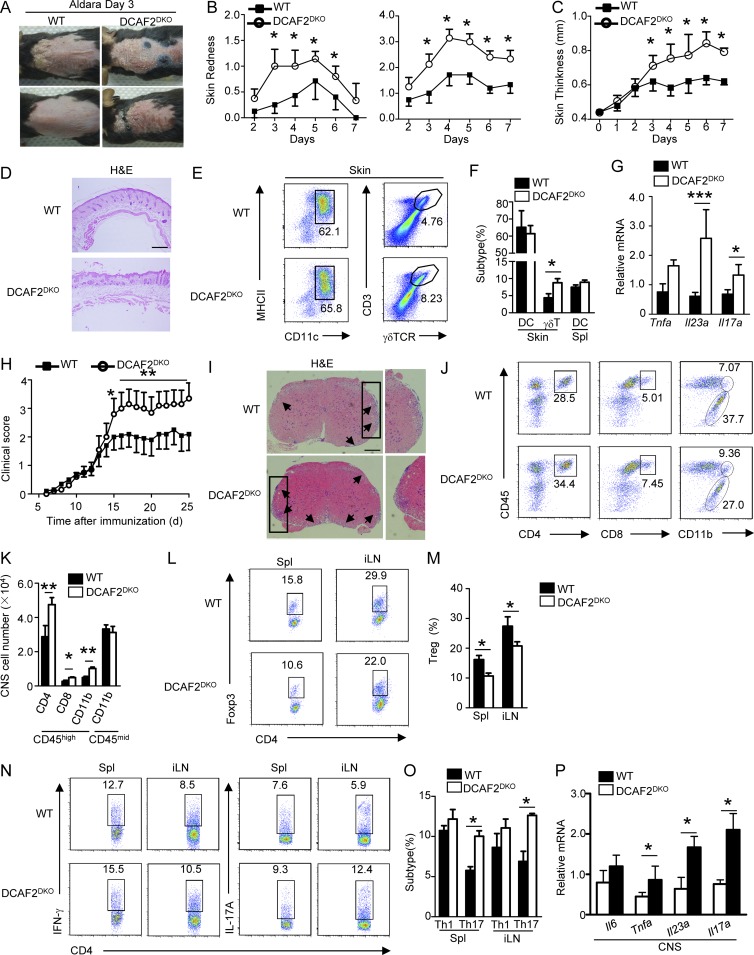
DCAF2 deficiency in DCs aggravates various autoimmune diseases. WT and DCAF2DKO mice (n = 8/group) were treated with Aldara for 6 d. (A–C) Representative photos taken on day 3 after Aldara treatment. Back skin lesions at day 4 represented as percent change in skin redness, scaling (B), and thickness (C). (D) Back skin sections stained with H&E on day 4 after treatment; bar, 200 µm. (E and F) Plots (E) and bar (F) graphs represented flow cytometry analysis of inflamed skin. Cells were gated on CD45+CD11c+ for the presence of skin-resident DCs and skin-infiltrating γδT cells. (G) Real-time quantitative PCR analysis of cytokines expression in skin samples on day 5 after Aldara treatment. (H) Mean clinical scores of WT and DCAF2DKO mice subjected to MOG35-55–induced EAE (n = 10/group). (I) H&E staining of spinal cord sections from WT and DCAF2DKO EAE mice (n = 3/group) for visualizing immune cell infiltration (arrows). Bar, 200 µm. (J and K) Flow cytometry analyses of immune cell infiltration into the CNS (brain and spinal cord) of EAE mice (n = 3/group). (L and M) Flow cytometry analysis of Treg cells frequency in the Spl and draining lymph nodes of EAE mice (n = 3, day 14 post-immunization). (N and O) Flow cytometry analysis of Th1 and Th17 cells gating with CD4+CD45hi in the splenic and draining lymph nodes of EAE mice (n = 3/group). (P) qRT-PCR analysis to determine the relative mRNA expression level of pro-inflammatory genes in spinal cords of EAE mice (n = 3/group). Data were normalized to a reference gene, Actb. All Data are representative of three independent experiments. Error bars show mean ± SEM. Significance was determined by two-tailed Student’s t test. *, P < 0.05; **, P < 0.01; ***, P < 0.005.

