Figure 2.
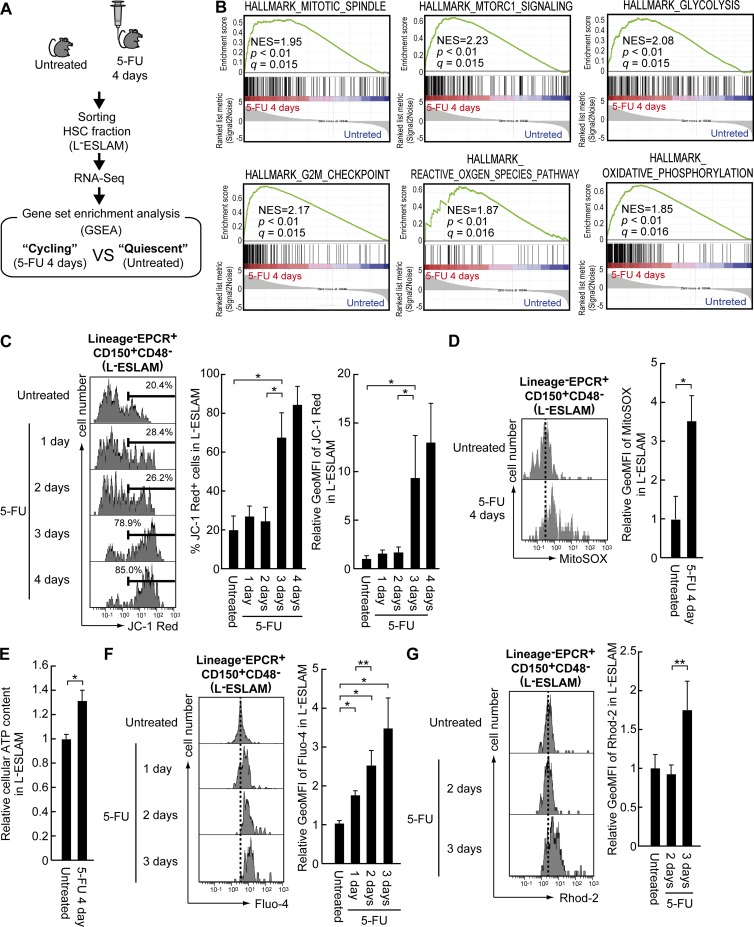
HSCs show the enhancement of ΔΨm following increased intracellular Ca2+ level immediately before entering cell cycle. (A) GSEA following RNA-seq to compare between “cycling” HSCs derived from BM of 5-FU–treated mice (250 mg/kg, i.v. after 4 d) and “quiescent” HSCs derived from untreated mice (n = 4, two independent experiments). (B) Enrichment of energy metabolism–related genes within up-regulated gene in cycling HSCs. NES, normalized enrichment score; q value, false discovery rate. (C) Kinetic change of ΔΨm in L−ESLAM HSCs after 5-FU treatment. Histograms show the fluorescent intensity of JC-1 Red, which reflects the height of ΔΨm. Graphs depict the frequency of JC-1 Red+ cells (left) or relative fluorescent intensity of JC-1 Red (right) in L−ESLAM fraction (n = 4, four independent experiments). (D) Mitochondrial superoxide level in L−ESLAM HSCs of untreated or 5-FU–treated mice (250 mg/kg, i.v. after 4 d). Histograms show the fluorescent intensity of MitoSOX, a mitochondrial superoxide indicator (n = 4, two independent experiments). (E) ATP content in L−ESLAM HSCs in untreated or 5-FU–treated mice (250 mg/kg, i.v. after 4 d). Data are expressed as the mean ± SD (n = 4, two independent experiments). (F and G) Kinetic changes of intracellular (F) or mitochondrial Ca2+ concentration (G) in L−ESLAM HSCs after 5-FU administration. Histograms show the fluorescent intensity of Fluo-4 (intracellular Ca2+ level) or Rhod-2 (mitochondrial Ca2+ level). Data are expressed as the mean ± SD (n = 4, two independent experiments; *, P < 0.01; **, P < 0.05 by t test).

