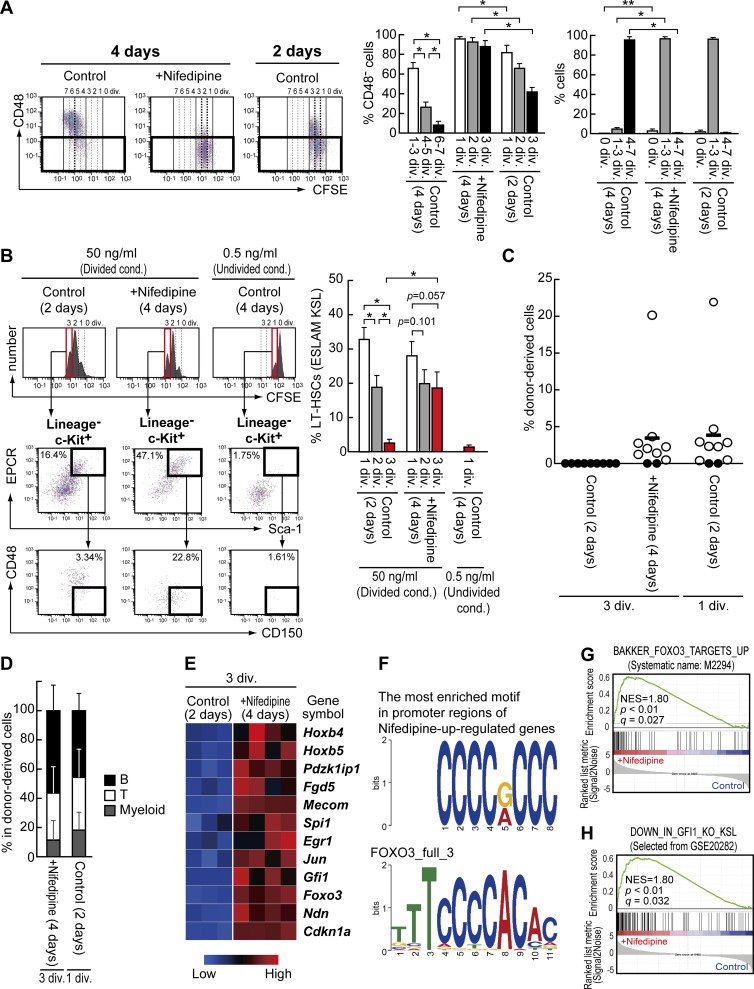
Figure 5.
Ca2+ channel blocker maintains functional HSCs through up-regulating expression of HSC regulators. (A and B) HSC phenotypes after HSC divisions in the absence (Control) or presence of 60 µM Nifedipine (+Nifedipine) for 4 or 2 d. Graphs depict the frequency of CD48− cells (A; left), cell division number (A; right) or the frequency of ESLAM LSK cells (B). The percentage in each dot plot represent the frequency of indicated fractions within one cell–division or three cell–division populations (B). Data are presented as means ± SD (n = 4, four independent experiments). (C and D) Transplantation assay using 50 cells derived from three-divided populations (Ly5.1) after the culture as described above, along with 2 × 10⁵ competitor cells (Ly5.2). Open or closed circles represent donor cell chimerism in multilineage-reconstructed recipient mice or unreconstructed mice after 20 wk in the plot, respectively (C). Bars indicate mean values (n > 9, two independent experiments). The graph depicts the frequency of each linage cells within donor-derived cells (D). Data are presented as means ± SD (n = 8, two independent experiments). (E–H) Gene expression analyses of three-divided ESLAM LSK HSCs after the culture as described above. RNA-Seq (heat map) revealed expression level of indicated genes (n > 3, two independent experiments, P < 0.01 EdgeR, q < 0.05 by FDR; E). The most enriched motif in the promoters of genes up-regulated by nifedipine (F; upper, E value = 2.2 × 10−84) which significantly resembles the FOXO3 binding motif (F; lower, q = 0.0492). Enrichment of Foxo3-targeted gene set “BAKKER_FOXO3_TARGETS_UP” (G) or Gfi1-dependent gene set “DOWN_IN_GFI1_KO_KSL” (H) within Nifedipine-up-regulated genes.

