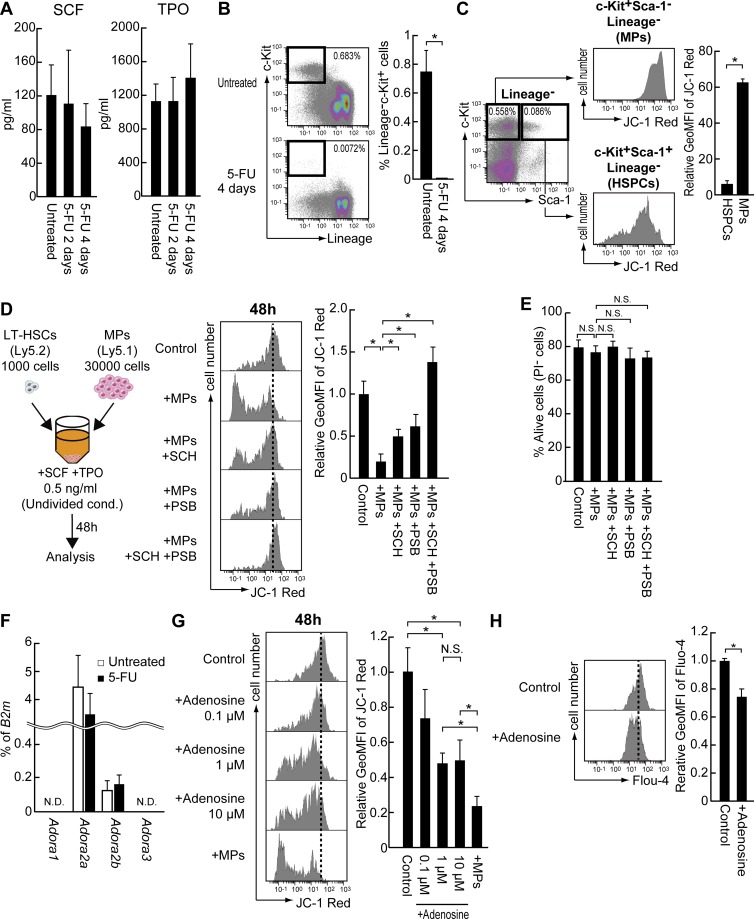
Figure 6.
Extracellular adenosine acts as a regulator to regulate Ca2+–mitochondria pathway. (A) The amount of SCF or TPO within BM in untreated or 5-FU–treated mice. Data are expressed as the mean ± SD (n = 4, two independent experiments). (B) The frequency of lineage−c-kit+ cells within total BM cells after 5-FU treatment (250 mg/kg, i.v; n = 4, two independent experiments). (C) ΔΨm of indicated fractions in untreated mice. Numbers in dot plots represent the frequency of gated cells within total BM cells. Data are presented as means ± SD relative to the value of L−ESLAM HSCs. (n = 4, two independent experiments). (D and E) ΔΨm (D) or viability (E) of HSCs after the co-culture of MPs (linage−c-Kir+Sca-1−) for 48 h in the absence or presence of 10 µM SCH442416 (SCH: Adora2a antagonist) and/or 10 µM PSB1115 (PSB: Adora2b antagonist). Cells cultured without both MPs and antagonists serve as control. n = 4, four independent experiments. (F) Expression of adenosine receptors in HSCs before and after 5-FU administration. Data are expressed as the mean ± SD relative to B2m expression (n = 4, two independent experiments by t test). (G and H) ΔΨm (G) or intracellular Ca2+ level (H) in HSCs after the culture with adenosine for 48 h or immediately after the stimulation (10 µM adenosine), respectively. Cells cultured without adenosine serve as control. Data are presented as means ± SD (n = 5, three independent experiments, *, P < 0.01 by t test [G]; n = 4, two independent experiments, *, P < 0.01 by t test [H]). N.S., not significant.

