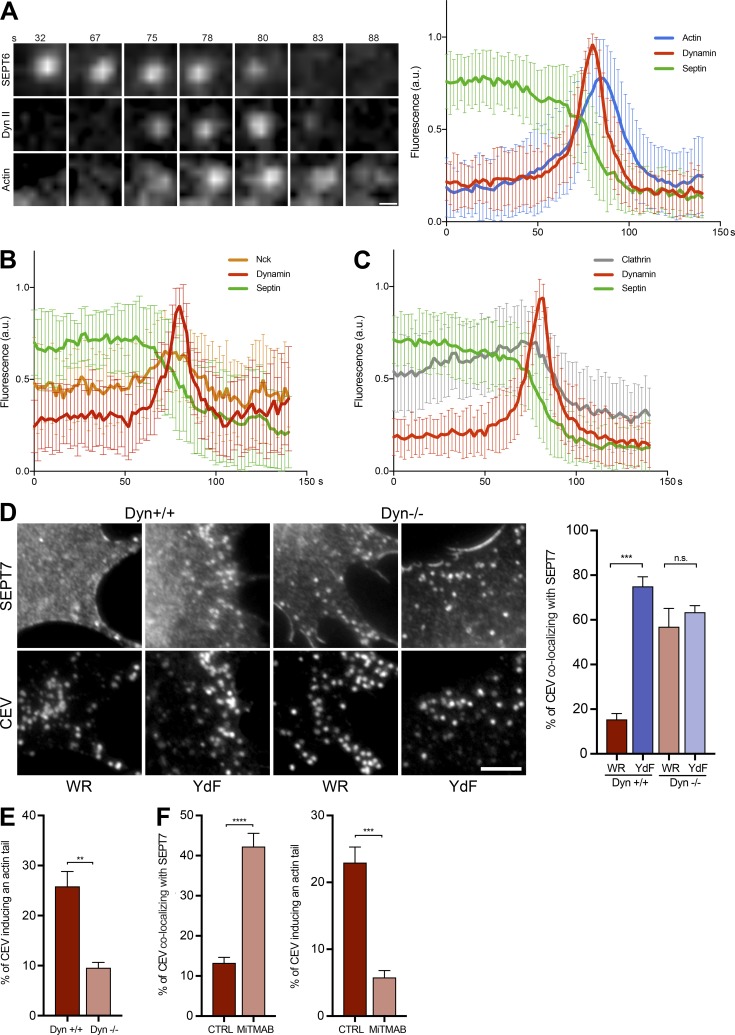
Figure 9.
Dynamin promotes loss of septin from CEV. (A) Video stills of the association of GFP-SEPT6, mCherry-dynamin (Dyn) II, and LifeAct-iRFP (Actin) with CEV in WR-infected HeLa cells at the indicated time. See Video 6. The graph shows the mean normalized fluorescence intensity of each protein on the virus over time. Loss of septin coincides with the recruitment of dynamin and actin polymerization before virus movement. (B) The graph shows the mean normalized fluorescence intensity of GFP-SEPT6, iRFP–dyn II, and RFP-Nck associated with CEV in HeLa cells infected with WR. The time in seconds is shown above the stills. See Fig. S4 B and Video 7. (C) The graph shows the mean normalized fluorescence intensity of GFP-SEPT6, mCherry-clathrin light chain (Clathrin), and iRFP–dyn II on CEV in WR-infected HeLa cells over time. See Fig. S4 C and Video 8. (D) Immunofluorescence images showing the recruitment of SEPT7 to CEV in dynamin parental (Dyn +/+) and knockout (Dyn −/−) cells infected with WR and the YdF virus. Bars, 5 µm. The graph shows the percentage CEV in WR- and YdF-infected cells recruiting SEPT7 in the presence (+/+) or absence (−/−) of dynamin at 14 h after infection. (E) The graph shows the percentage of CEVs inducing actin tails in WR-infected cells in the presence (+/+) or absence (−/−) of dynamin. (F) Quantification of the percentage of CEV recruiting SEPT7 and inducing actin tails in WR-infected HeLa cells treated with the dynamin inhibitor MiTMAB. In the graphs in A, B, and C, the error bars represent SD from three independent experiments in which a total of >70 virus particles were analyzed. In the graphs in D and E, the error bars represent SEM from three independent experiments in which >900 CEVs were analyzed across 30 cells. In the graphs in F, >1,500 virus particles from five independent experiments were analyzed across 50 cells. Bars: (A) 500 nm; (D) 5 µm. **, P < 0.01; ***, P < 0.001; ****, P < 0.0001.

