Figure 4.
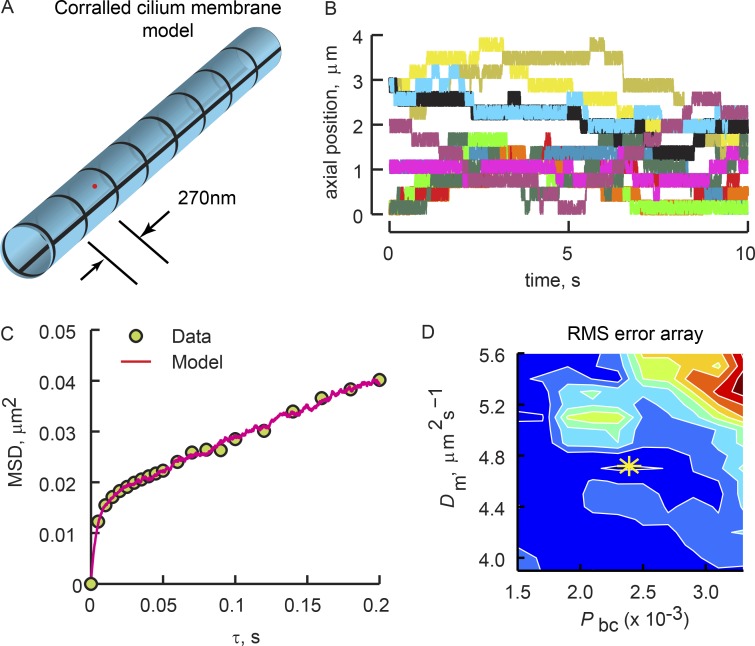
Fitting of corralled diffusion model to the high-speed tracking results reveals low probability of corral boundary crossing. (A) Schematic of the corralled ciliary membrane simulation (see Theory). (B) Kymographs from 12 separate runs of the corralled diffusion simulation that yielded the best fit of the particle tracking results from the experiment shown in Fig. 3. Note the large variation in corral residence time, Tr, resulting from the stochastic corral boundary crossings. See Table 2, cilium R9 for fitting parameters. (C) MSD(τ) plots of the high-speed tracking experiment from Fig. 3 (symbols) and the simulation that provided the best fit (red line). (D) Array of the RMSE between the model and tracking data. White lines are iso-error lines. Colors are heat maps depicting relative regional error, where red is larger and dark blue is smaller error. The yellow asterisk shows the minimal error, found as the centroid of the smallest iso-error line, indicating the values of Dm and Pbc producing the best fit of the data.

