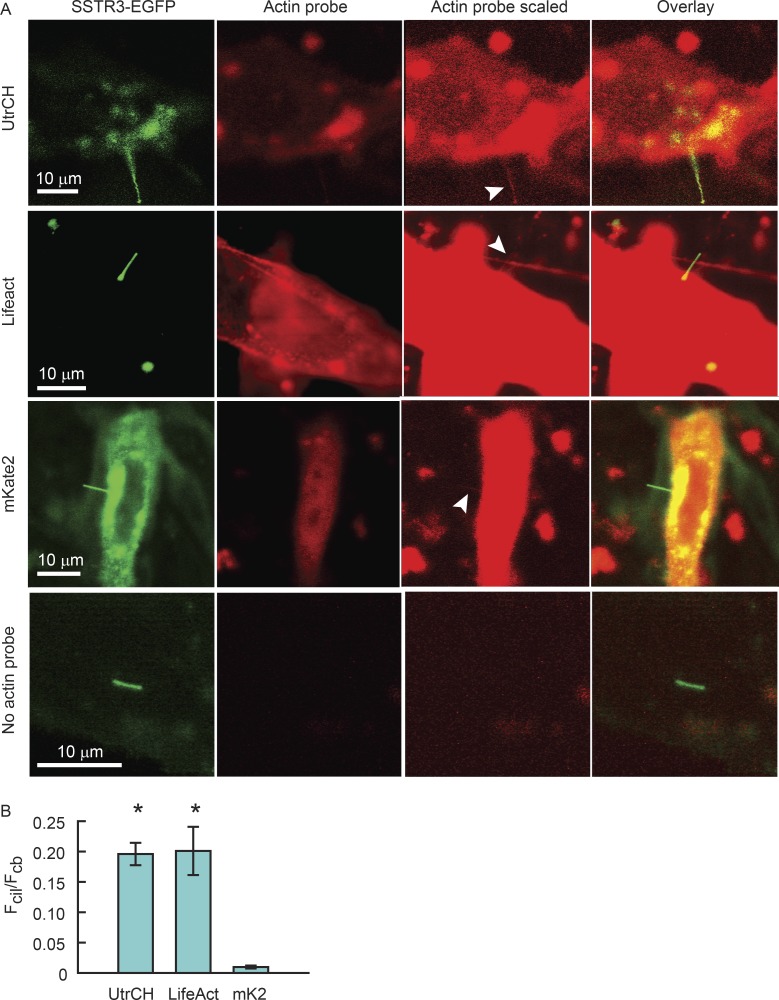
Figure 8.
F-actin is present within IMCD3 cilia at low levels. (A) IMCD3 cells were transfected with plasmids expressing SSTR3-EGFP and UtrCH-RFP, Lifeact-mCherry, or unfused mKate2, and ciliogenesis was initiated by serum starvation. Cells were imaged live by confocal microscopy using identical microscope settings, where green and red channels were not saturated (actin probe). To visualize actin probe signal within cilia, the red channel was scaled arbitrarily after acquisition (actin probe scaled). This scaling did not affect actual pixel counts. White arrowheads indicate red fluorescent signal within the cilia. All three species of red fluorescent proteins were found in cilia, including the unfused mKate2, showing that soluble fluorescent proteins expressed in the cell have access to the ciliary compartment. Actin probe panels displayed at optimal intensity scaling, showing that images were acquired without saturation. Actin probe scaled panels were intensity scaled to reveal cilium signal. (B) Mean ± SEM. Fcil/Fcb ratios. Asterisks indicate significant differences compared with unfused mKate2. UtrCH, n = 9; one independent experiment; Lifeact, n = 22; five independent experiments; unfused mKate2, n = 7; two independent experiments, no probe, n = 5; one independent experiment.

