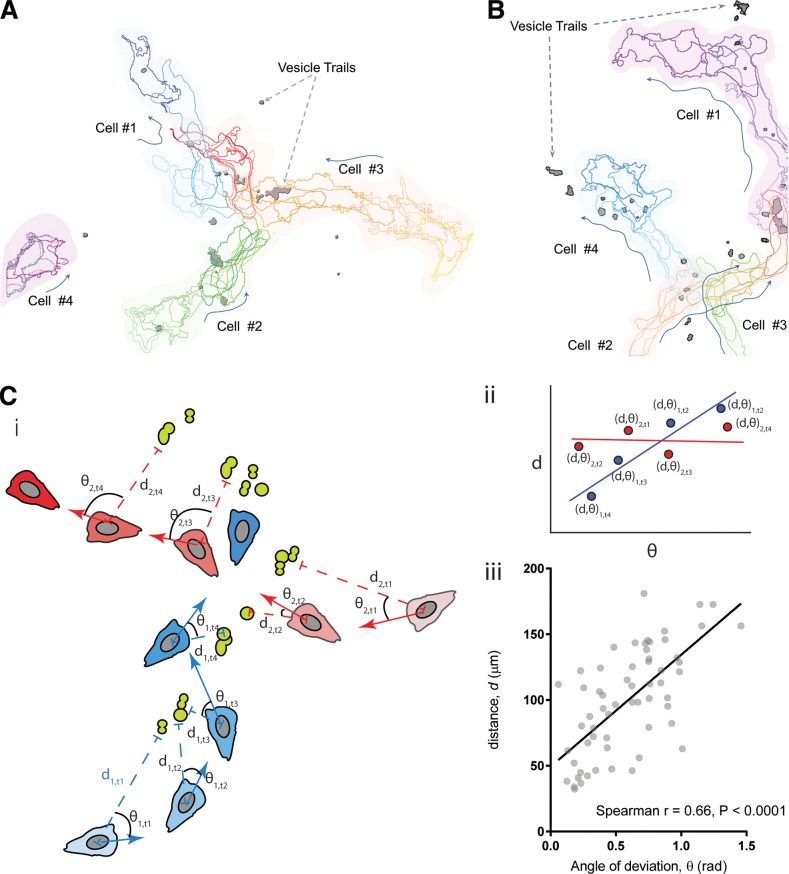
Figure 2.
Vesicular trails released by migrating cells are capable of attracting other cells. (A and B) Cell outline traces resolved from maximum-intensity fluorescent images of ACA-YFP/aca− cells moving toward a spontaneously formed aggregate of cells, showing the relative position of migrating cells with respect to secreted vesicles containing ACA-YFP (dark gray). Time evolution of the cell outlines are shown from lighter to darker colors for each cell. (C [i]) Cartoon showing the principle used for the analysis of the chemoattractive potential of the released trails. The cartoon shows the different positions of two simulated cells colored in blue and red. The blue cell follows a simulated vesicular trail shown in green, and the red cell moves randomly irrespective of the trail position. Their time evolution (t1–t4) is shown in deepening shades, with darker shades showing the position of cells at later time points. di,t denotes the distance of the ith cell to its nearest vesicle at time point t, whereas θ denotes the angle between its direction of motion and the direction vector to the nearest EV. (C [ii]) A simulated d–θ correlative plot showing the behavior of cells depicted in Ci. (C [iii]) d–θ correlative plot of migrating cells derived from Video 3 (A and B) showing positive correlation between d and θ.

