Figure 3.
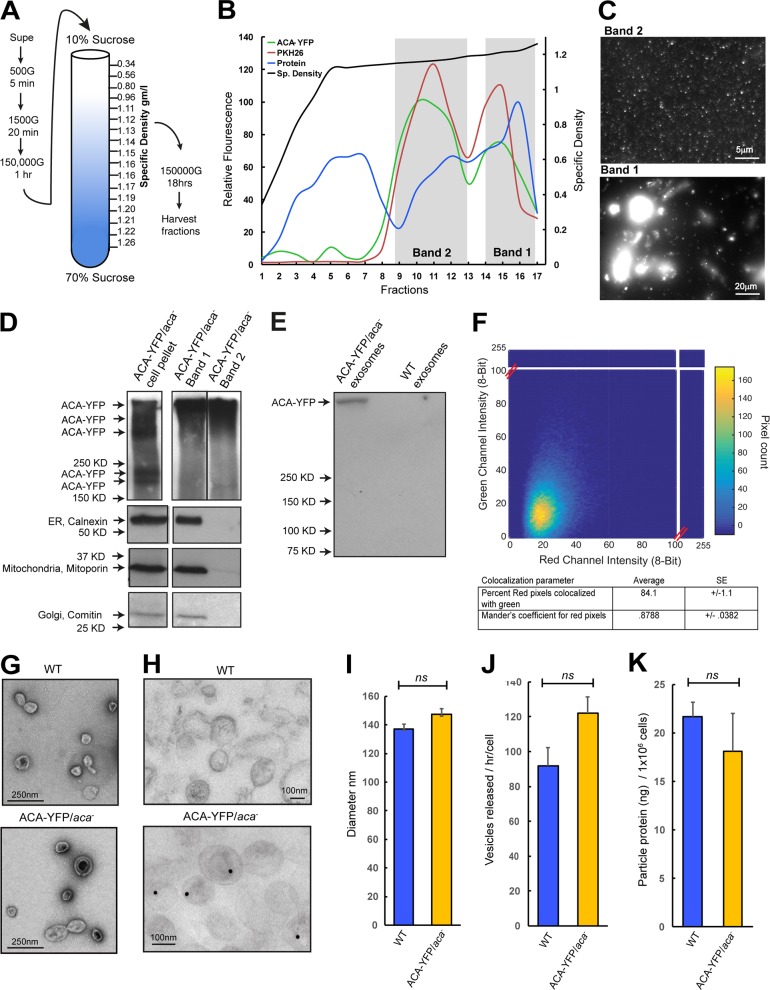
Isolation and characterization of D. discoideum EVs. (A) Purification scheme for the isolation of EVs from D. discoideum cell supernatants. See Supplemental methods for details. (B) Graph of the density gradient fractions of isolates from the supernatants of ACA-YFP/aca− cells showing protein concentration (blue), relative lipid levels stained with the lipid dye PKH26 (red), ACA-YFP levels measured by YFP fluorescence (green), and specific density of the gradient (black). Areas marked in gray demarcate bands of high lipid and protein concentration that were characterized in C and D. (C) Diffraction-limited fluorescence images of the vesicular contents of the two bands isolated from a 10–70% sucrose gradient. (D) Western blots of ACA-YFP, calnexin, mitoporin, and comatin highlighting purity of the preparations. The ACA-YFP samples were run on the same high-percentage gel, but not side by side. Results representative of two independent experiments. (E) Immunoprecipitation of ACA-YFP from EV isolates using a GFP specific antibody. Results representative of two independent experiments. (F) 2D correlative histogram of total and ACA-YFP fluorescence of EVs isolated from ACA-YFP/aca− cells. Total EVs were detected by FM4-64 staining. Inset table shows the percentage of red pixels also positive for YFP, calculated from a correlative matrix of individual deconvolved pixels. (G and H) Electron micrographs of whole EVs isolated from ACA-YFP/aca− or WT cells stained with uranyl acetate (G) or colloidal gold for YFP (H). (I–K) Graphs depicting the mean diameter (I), number (J), or protein concentration (K) of EVs isolated from 4.5 × 10⁹ ACA-YFP/aca− or WT cells. All statistics are shown as mean ± SEM of three independent experiments, unless mentioned otherwise. ns, P > 0.05.

