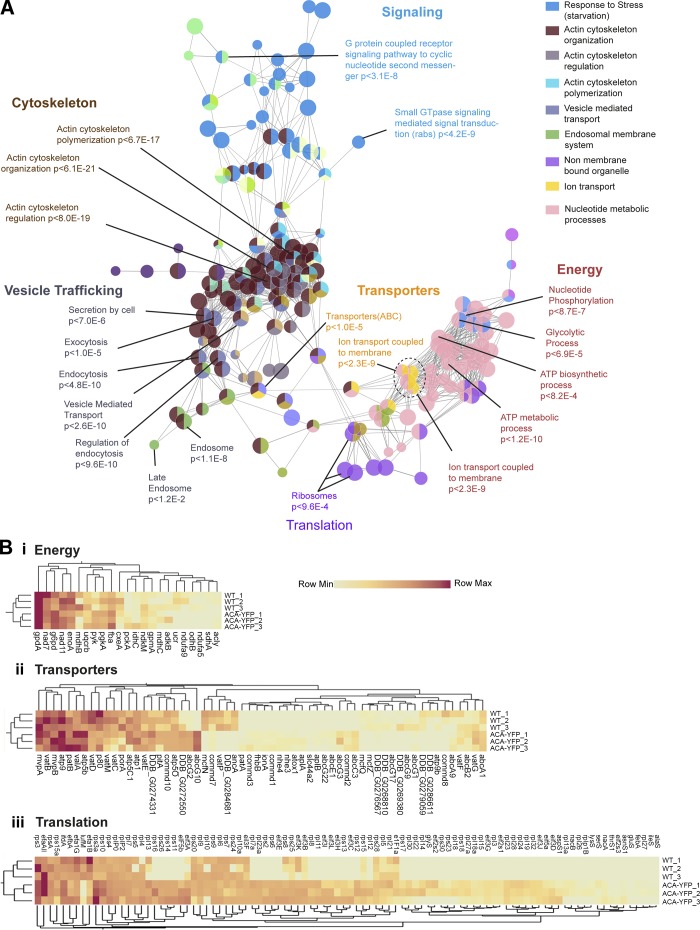
Figure 5.
Network analysis and statistical appraisal of EV proteins. (A) Network analysis of GO terms identified from MS of WT EVs. Nodes corresponding to functional groups with high statistical significance and identified in MS analysis are labeled, and their enrichment probabilities relative to the D. discoideum genome are recorded in the label. The legend on the right gives the GO term category for each node color. (B [i–iii]) Heat map and cluster analysis of relative PSMs of proteins involved in ATP generation (B [i]), transport (B [ii]), and translation (B [iii]) derived from three separate MS analyses for EVs from ACA-YFP/aca− and WT cells.

