Figure 3.
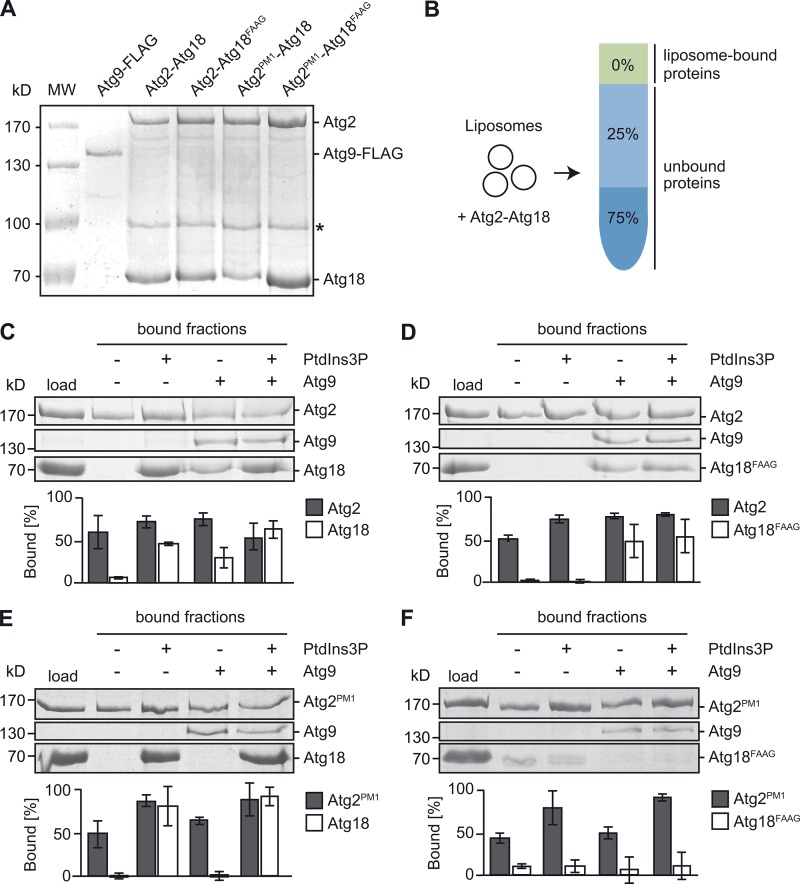
Atg2 binding to Atg9 promotes its direct interaction with Atg18. (A) Purified Atg9 and Atg2–18 complexes. Atg9-3×FLAG and Atg2–Atg18–TAP complexes were overproduced in yeast and purified as described in Materials and methods. Isolated proteins were separated by SDS-PAGE and visualized in gels with Coomassie staining. The asterisk indicates a degradation product. MW, molecular weight. (B) Schematic representation of liposome flotation assays. Liposomes containing or not containing Atg9 were incubated with purified Atg2–Atg18 complexes and mixed with 75% sucrose. Subsequent density centrifugation allowed separating unbound protein (bottom) from liposomes with bound protein (top). (C–F) Interaction of Atg2 and Atg18 with liposomes. Liposomes consisting of 69–72 mol% DOPC, 15 mol% DOPE, 12 mol% DOPS, 0.5 mol% Atto550-DPPE, and 0 or 3 mol% PtdIns3P were reconstituted with or without purified Atg9 in a 1:1,000 protein/lipid ratio. Top fractions of different liposome species incubated with purified Atg2–Atg18 (C), Atg2–Atg18FAAG (D), Atg2PM1–Atg18FAAG (E), or Atg2PM1–Atg18 (F) were TCA precipitated and loaded on SDS-PAGE gel. To analyze the amount of bound protein, gels were stained with Coomassie, and band intensities were quantified using ImageJ. The graphs show mean quantifications of three independent experiments ± SD.

