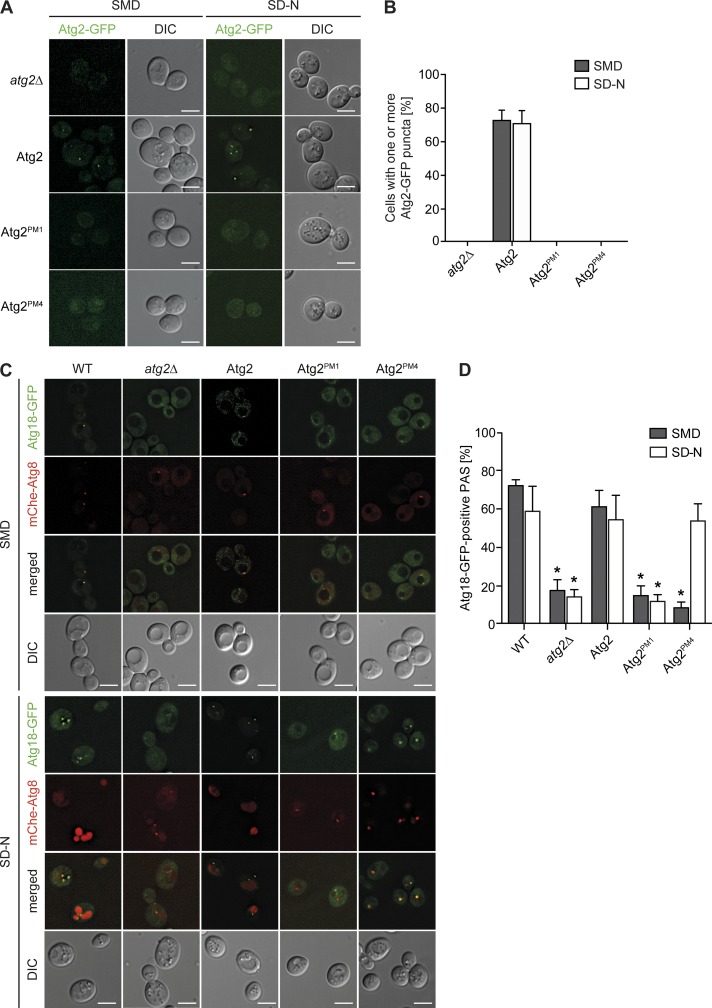
Figure 6.
Atg2PM1 and Atg2PM4 mutants are not normally distributed to the PAS. (A) Cellular distribution of Atg2-GFP variants in atg2Δcells (FRY375) transformed with plasmids expressing Atg2-GFP, Atg2PM1-GFP, or Atg2PM4-GFP. Strains were grown to an early log phase before being nitrogen starved for 3 h. Cells were imaged by fluorescence microscopy before and after nitrogen starvation. (B) Quantification of the percentage of cells with one or more Atg2-GFP–positive dot in the experiment presented in A. (C) Atg2 binding to Atg9 is required for Atg18 recruitment to the PAS. Cellular distribution of endogenous Atg18-GFP in WT (RSGY017) or atg2Δ (RSGY018) carrying mCherryV5-Atg8 fusion protein and transformed with integrative plasmids expressing TAP-tagged versions of Atg2 (pATG2-TAP(405); RSGY019), Atg2PM1 (pATG2PM1-TAP(405); RSGY020), or Atg2PM4 (pATG2PM4-TAP(405); RSGY021) strains. Strains were grown to an early log phase before being nitrogen starved for 3 h. Cells were imaged by fluorescence microscopy before and after nitrogen starvation. DIC, differential interference contrast. Bars, 5 µm. (D) Quantification of the percentage of cells with colocalizing puncta presented in C. Graphs represent means of three experiments ± SD. Asterisks highlight significant differences with the strain carrying WT Atg2.

