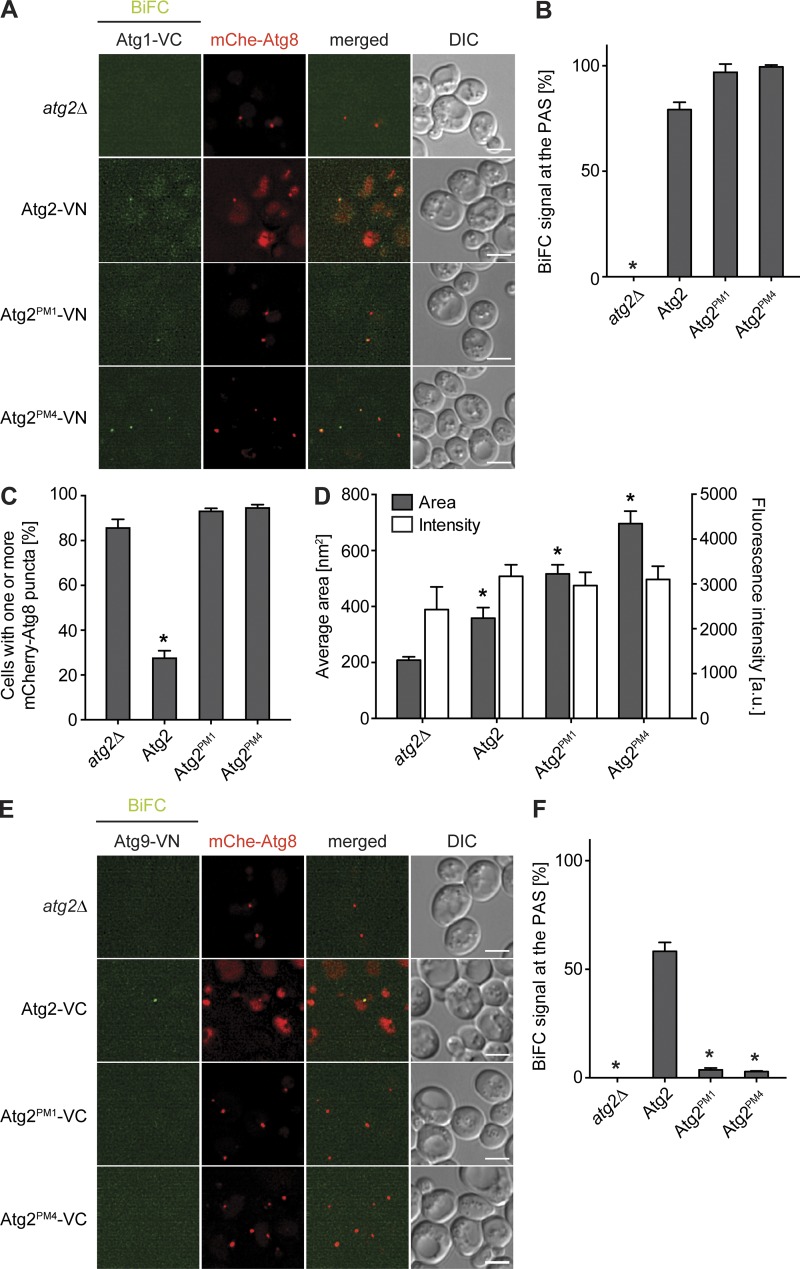
Figure 8.
Atg2PM1 and Atg2PM4 are recruited to the PAS, but they have altered distribution on the phagophore. (A) Atg2 localization at the PAS was visualized by BiFC. Strains (RSGY087, RSGY089, and RSGY090) expressing both endogenous Atg1-VC and Atg2-VN, Atg2PM1-VN, or Atg2PM4-VN and carrying a mCherryV5-Atg8 construct were grown to an early log phase in YPD before being nitrogen starved for 3 h and imaged. Cells (RSGY088) expressing only Atg1-VC and mCherryV5-Atg8 were used as controls. (B) Quantification of the percentage of BiFC puncta colocalizing with mCherry-Atg8 in the experiment shown in A. (C) Quantification of percentage of cells that present at least one mCherryV5-Atg8 punctum in A. (D) Quantification of the mean size in nm2 and intensity of the fluorescent signal in a.u. of mCherryV5-Atg8 puncta depicted in A. Data analysis was performed as described in Materials and methods. (E) Atg2–Atg9 interaction at the PAS was visualized by BiFC. Strains (RHY031, RHY032, and RHY033) expressing both endogenous Atg9-VN and Atg2-VC, Atg2PM1-VC, or Atg2PM4-VC and carrying a pCumCherryV5ATG8 construct were processed as in A. Cells (RHY030) expressing only Atg9-VN and mCherryV5-Atg8 were used as a control. DIC, differential interference contrast. Bars, 5 µm. (F) Quantification of the percentage of BiFC puncta colocalizing with mCherry-Atg8 in the experiment shown in E. Graphs represent means of three independent experiments ± SD. Asterisks highlight significant differences with the strains expressing WT Atg2 (B and F) or atg2Δ (C and D) cells.

