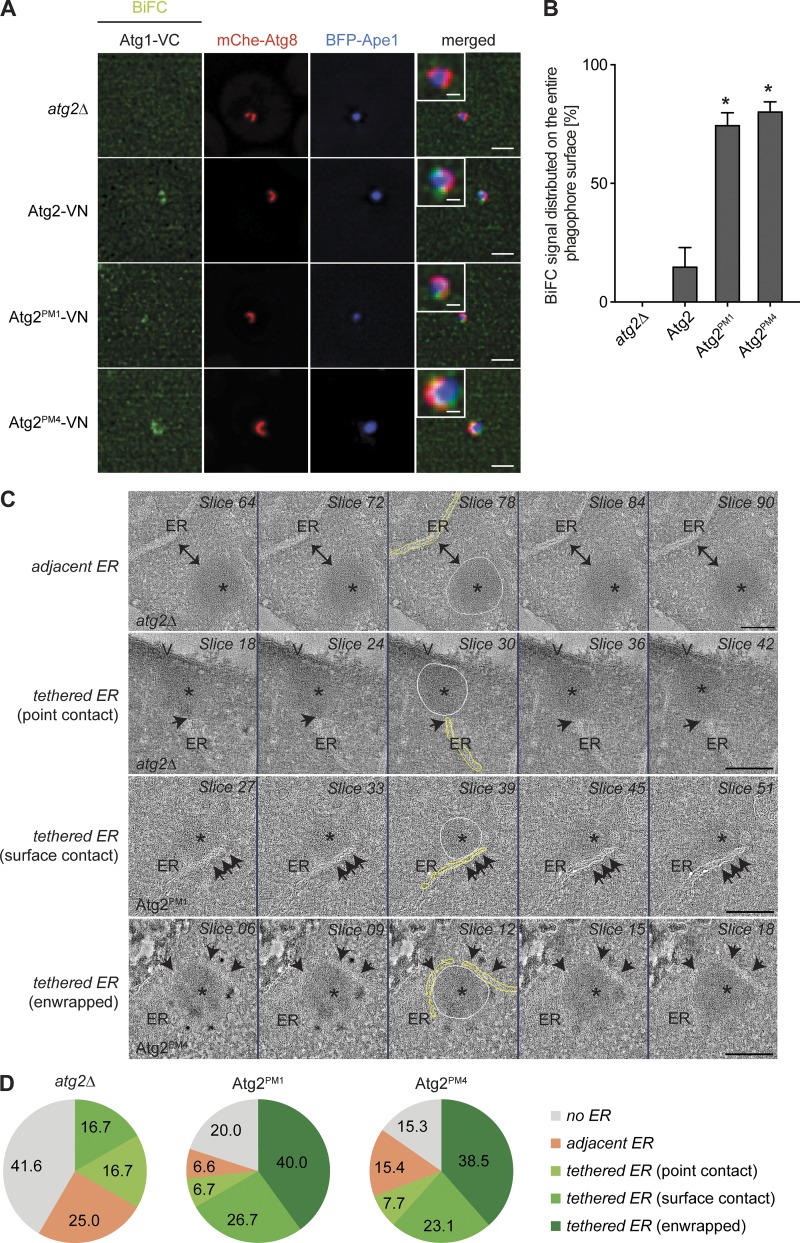
Figure 9.
The PAS and the ER are in close association in Atg2PM1- and Atg2PM4-expressing cells. (A) Strains analyzed in Fig. 8 A (RSGY087, RSGY088, RSGY089, and RSGY090) were transformed with the pDP245 plasmid and grown to an exponential phase before adding 250 µM of CuSO4 4 h before reaching 0.6 OD600. At that point, 400 nM of rapamycin was added, and incubation was continued for an additional 3 h. Bars: (main images) 1 µm; (insets) 300 nm. (B) Quantification of the percentage of BiFC signal detected on the entire surface of the mCherry-Atg8–positive phagophore and not on its extremities in the experiment shown in A. The graph represents the mean of three experiments ± SD. Asterisks indicate significant differences with the strain carrying WT Atg2. (C) Cryosections of 250–300 nm from either the atg2Δ mutant or cells expressing Atg2PM1 or Atg2PM4 were labeled with an anti-Ape1 antibody (10 nm gold; indicated with red spheres in videos). Using a conventional electron microscope, the areas of interest were selected based on the immunogold labeling, and dual-tilt series were recorded using a 200-kV transmission electron microscope. Tomographic slices (inverted grayscale) extracted from different tomograms illustrating different types of association between the Ape1 oligomer and the ER. Single- and double-direction arrows indicate the region of contact and the distance, respectively, between the Ape1 oligomer and the ER. The contours of the Ape1 oligomer (white) and of the ER (yellow) are shown in the middle panels. V, vacuole. Asterisks indicate Ape1 oligomers. Bars: (adjacent ER) 156 nm; (tethered ER) 184 nm. Representative examples of types of associations are also shown as 3D reconstructions in Videos 1 (Ape1 oligomer in the atg2Δ mutant with adjacent ER at a distance between 30 and 150 nm), 2 (Ape1 oligomer in the atg2Δ strain with an ER tethered with a single point of contact), 3 (Ape1 oligomer in Atg2PM1-expressing cells with an ER tethered with a surface contact), and 4 (Ape1 oligomer in Atg2PM1-expressing cells with an ER tethered with enwrapping). (D) Quantification of the different Ape1–ER contacts profiles described in the text in the three analyzed strains in C.

