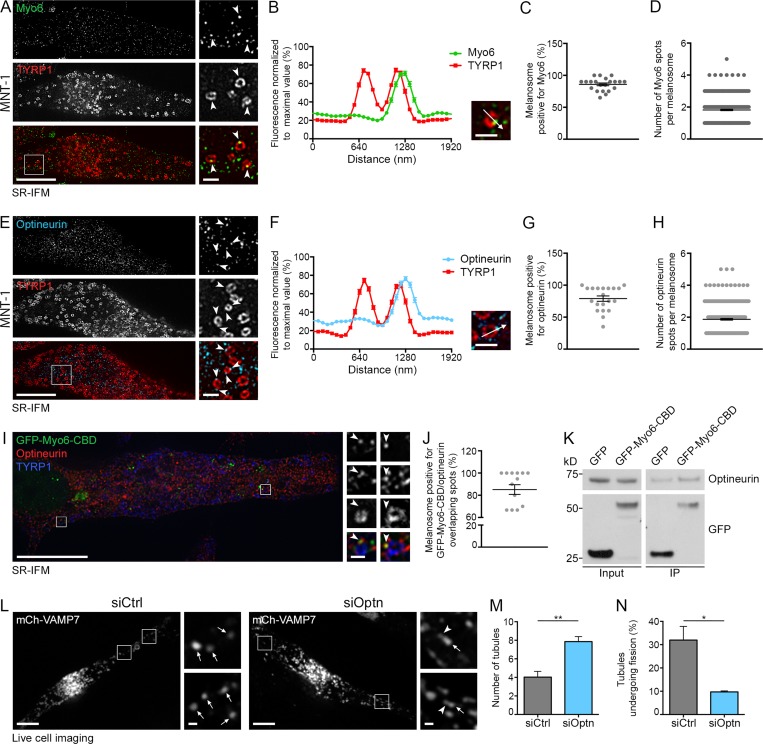
Figure 2.
Optineurin associates with Myo6 and releases melanosomal tubules. (A and B) SR-IFM on MNT-1 cells costained for endogenous Myo6 and TYRP1 (A) and linear pixel values across n melanosomes (B; n = 130) show Myo6 (A; arrowheads, 4× boxed regions) localization to TYRP1+ melanosomal subdomain. (C and D) Percentage of Myo6/TYRP1+ melanosomes (C; n = 15 cells), and relative number of Myo6+ spots per n melanosome (D; n = 441). (E and F) SR-IFM of MNT-1 cells costained for endogenous optineurin and TYRP1 (E) and linear pixel values across n melanosomes (F; n = 95) show optineurin (E; arrowheads, 4× boxed regions) localization to TYRP1+ melanosomal subdomain. (G and H) Percentage of optineurin/TYRP1+ melanosomes (G; n = 20 cells) and relative number of optineurin+ spots per n melanosome (H; n = 400). (I) SR-IFM on GFP-Myo6-CBD–expressing MNT-1 cells labeled for optineurin and TYRP1. Magnified views (4×) show Myo6 and optineurin codistribution on TYRP1+ melanosome subdomains. (J) Quantification of the percentage of melanosomes with overlapping GFP-Myo6-CBD and optineurin subdomains as in I (n = 14 cells). (K) Western blot analysis of lysates and GFP IPs of GFP- or GFP-Myo6-CBD–expressing MNT-1 cells probed for optineurin or GFP antibodies. (L) Live imaging frames of MNT-1 cells expressing mCh-VAMP7 and treated with control or optineurin (Optn) siRNAs. Magnified areas (4×) of boxed regions in siOptn cells show tubules (arrowheads) associated with melanosomes (arrows). (M) Relative number of mCh-VAMP7+ melanosomal tubules during 40-s movies per 256-µm2 area of cells treated as in L (siCtrl, n = 4 independent experiments; siOptn, n = 3 independent experiments). (N) Percentage of mCh-VAMP7+ tubules detaching from melanosomes in control- or optineurin-depleted cells (M and N; siCtrl, n = 4 independent experiments; siOptn, n = 3 independent experiments). Molecular masses are in kilodaltons. Data are presented as the mean ± SEM. Bars: (A, E, I, and L) 10 µm; (A, B, E, F, and L, magnifications) 1 µm; (I, magnifications) 500 nm. **, P < 0.01; *, P < 0.05 (unpaired t test).

