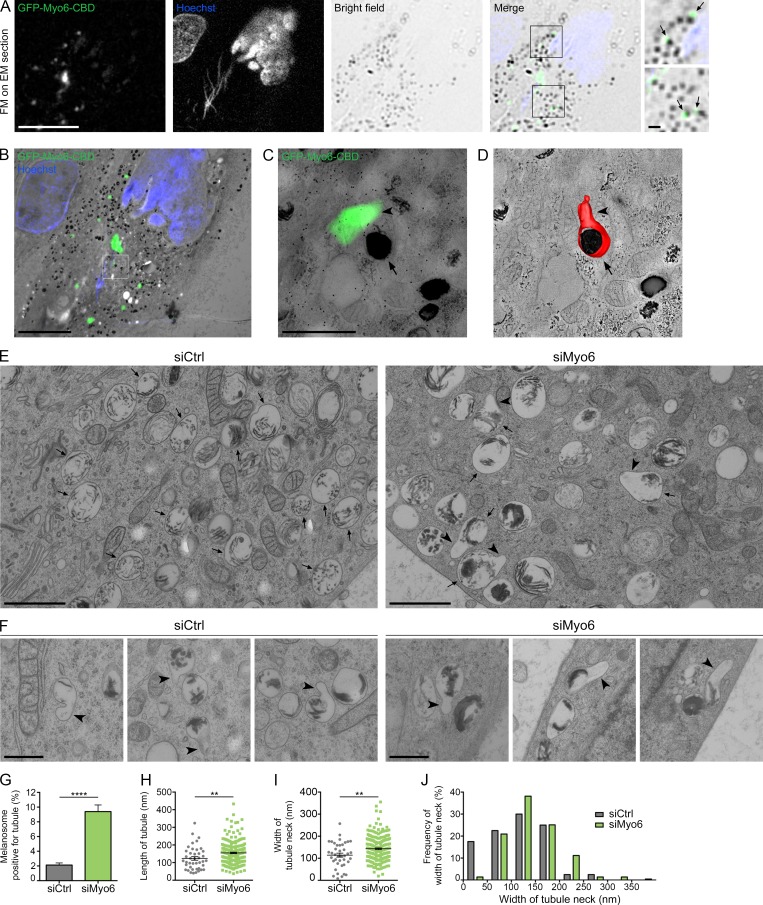
Figure 3.
Myo6 constricts the neck of melanosomal tubules. (A) FM focal projection from a 300-nm-thick EM section from a high-pressure frozen MNT1 cell expressing GFP-Myo6-CBD. GFP-Myo6-CBD (green) was preserved during freeze substitution. Nuclei (blue) were poststained with Hoechst (blue stripes outside the nucleus correspond to folds in the EM section). Black melanin pigment was imaged in bright field. Magnified area (2×) of the merged channels reveal GFP signals adjacent to melanosomes (arrows) that is comparable to that seen in live-cell imaging observations (Fig. 1 L). (B) FM and EM images of the section are registered and overlaid to identify GFP-Myo6-CBD+ pigmented melanosome (boxed area). (C) Zero-tilt image of the tomogram registered and overlaid with GFP-Myo6-CBD fluorescent signal. (D) Manually contoured 3D model shows the melanosomal membrane (red, arrow) filled with black melanin pigment and in continuity with an elongated tubule (arrowhead). (E) 70-nm electron micrograph from control- or Myo6-depleted MNT-1 cells. Upon siMyo6 treatment, large tubules (arrowheads) are connected and emanate from melanosomes (arrows). (F) Gallery of melanosomal tubules (arrowheads) associated with melanosomes in control- or Myo6-depleted cells. (G) Percentage of melanosomes positive for tubule per n cell on EM section (siCtrl, n = 27; siMyo6, n = 23). (H and I) Mean length of n tubules (H) and width of the neck (I) measured in cells treated as in E (siCtrl, n = 41; siMyo6, n = 215). (J) Distribution of the width of tubules neck. Data are presented as the mean ± SEM. Bars: (A and B) 10 µm; (C, E, F, and magnifications in A) 1 µm. ****, P < 0.0001; **, P < 0.01 (unpaired t test).

