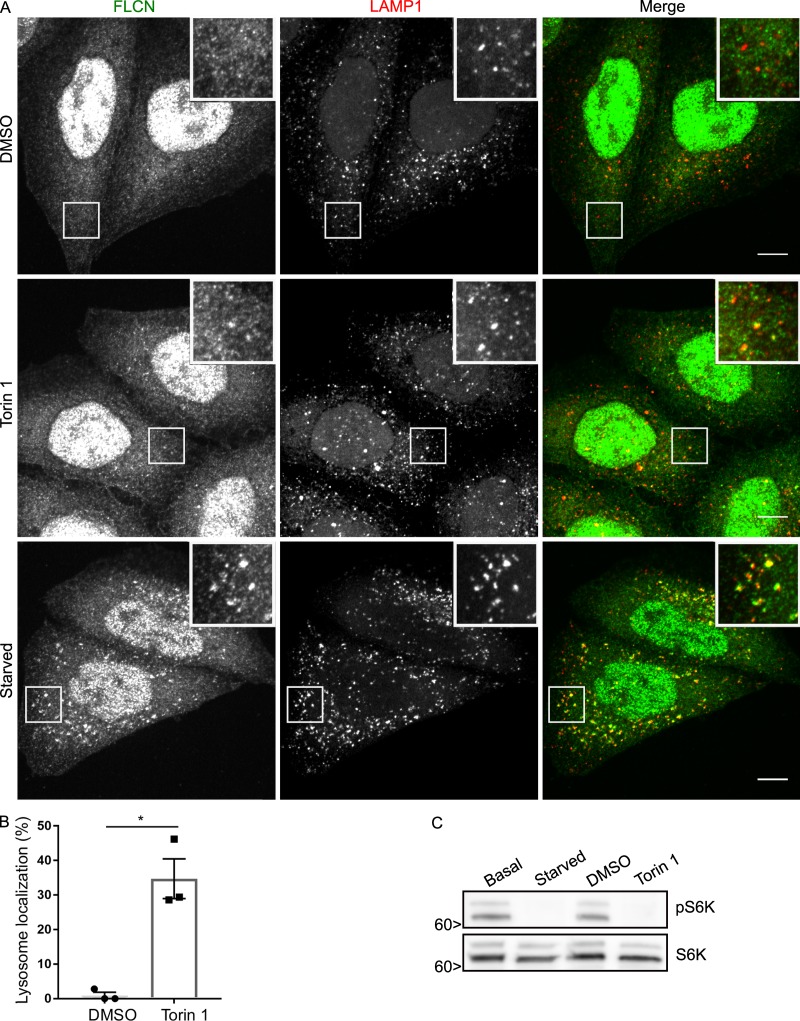
Figure 3.
Investigation of the effects of mTOR inhibition on FLCN lysosome localization. (A) Immunofluorescence analysis showing the effect of DMSO (vehicle control) versus Torin 1 (250 nM for 1 h) and starvation on FLCN localization in HeLa cells. Bars, 10 µm. Insets are 12 µm wide. (B) Quantification of the impact of Torin 1 treatment on FLCN localization to lysosomes (percentage of cells with five or more FLCN spots that are also LAMP1 positive; mean ± SEM; n = 3 experiments; 76–77 cells per condition; *, P < 0.05; Student’s t test). (C) Western blots showing the similar effects of starvation and Torin 1 on mTORC1 signaling. Molecular masses are given in kilodaltons.

