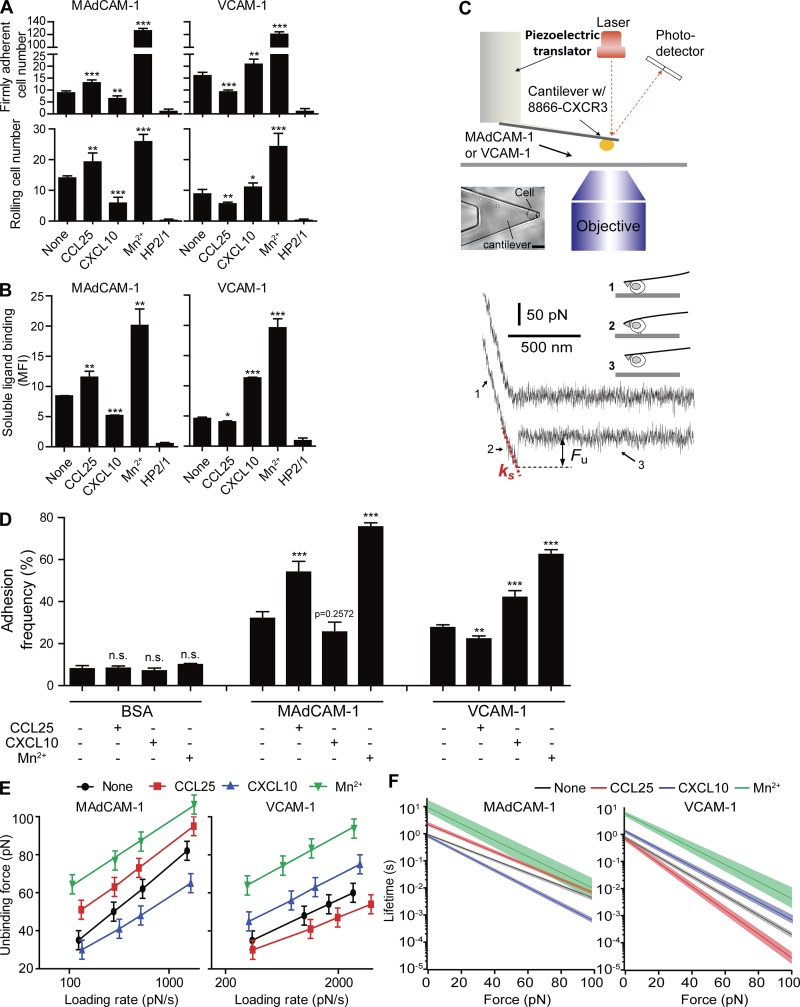
Figure 1.
Regulation of integrin α4β7–ligand binding affinity by chemokines and Mn2+. (A) Adhesion of RPMI 8866–CXCR3 cells to immobilized MAdCAM-1 and VCAM-1 substrates at 1 dyn/cm2 before and after stimulation with chemokines or 0.5 mM Mn2+. Data are represented as mean ± SD of technical quintuplicate samples (n = 5). (B) Binding of soluble MAdCAM-1 and VCAM-1 to RPMI 8866–CXCR3 cells before and after stimulation with chemokines or 0.5 mM Mn2+. Data are represented as mean ± SD of technical triplicate samples (n = 3). 2 µg/ml mAb HP2/1 was used to block the function of α4 integrin in A and B. MFI, mean fluorescence intensity. (C) AFM schematic. Top: Diagram illustrating key components of the custom-built setup. Bar, 20 µm. Bottom: Representative force-displacement retraction trace without (upper trace) or with (lower trace) adhesion. Fu, unbinding force of the α4β7–ligand complex. ks, system spring constant derived from the slope of the force-displacement trace. The cantilever retraction rate of the measurements was 3.7 µm/s. Bottom right: The three stages of stretching and detaching a single cell from the substrate. (D) Adhesion frequency of the AFM measurements for RPMI 8866–CXCR3 cells. Data are represented as mean ± SEM of >500 repeated force scans conducted using multiple cell-probe pairs. (E) Dynamic force spectra of single-bond MAdCAM-1 and VCAM-1 interactions with and without stimulation. Uncertainty in force is shown as half of the bin width of unbinding force histograms (Fig. S4, A and B). The linear fits of the DFS were obtained using Eq. 2. The fitted lines are superimposed on the respective DFS. (F) The force-dependent lifetimes of single-bond MAdCAM-1 and VCAM-1 interactions are given by Eq. 1. Shaded areas indicate an uncertainty of one SD. Two-tailed Student’s t test. *, P < 0.05; **, P < 0.01; ***, P < 0.001; n.s., P > 0.05.

