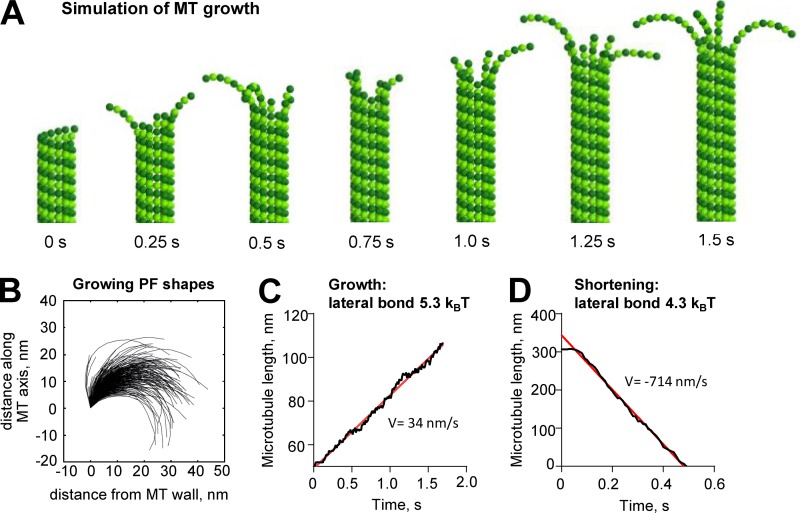
Figure 10.
MT growth with curved PFs illustrated with a Brownian dynamics model. (A) MT growth in a model with curved GTP-tubulin. (B) Shapes of simulated PFs on the growing MT tip. (C) Dependence of MT length on time in simulation with lateral bond 5.3 kBT yielding the polymerization rate V = 34 nm/s. Data in A–C correspond with Video 5. (D) Dependence of MT length on time in simulation with lateral bond 4.3 kBT yielding the depolymerization rate v = 714 nm/s. Note that initial pause before rapid MT shortening is caused by the start of the simulation from the metastable configuration with blunt end. The pause was excluded from the linear fit. Red lines are linear fits to data.

