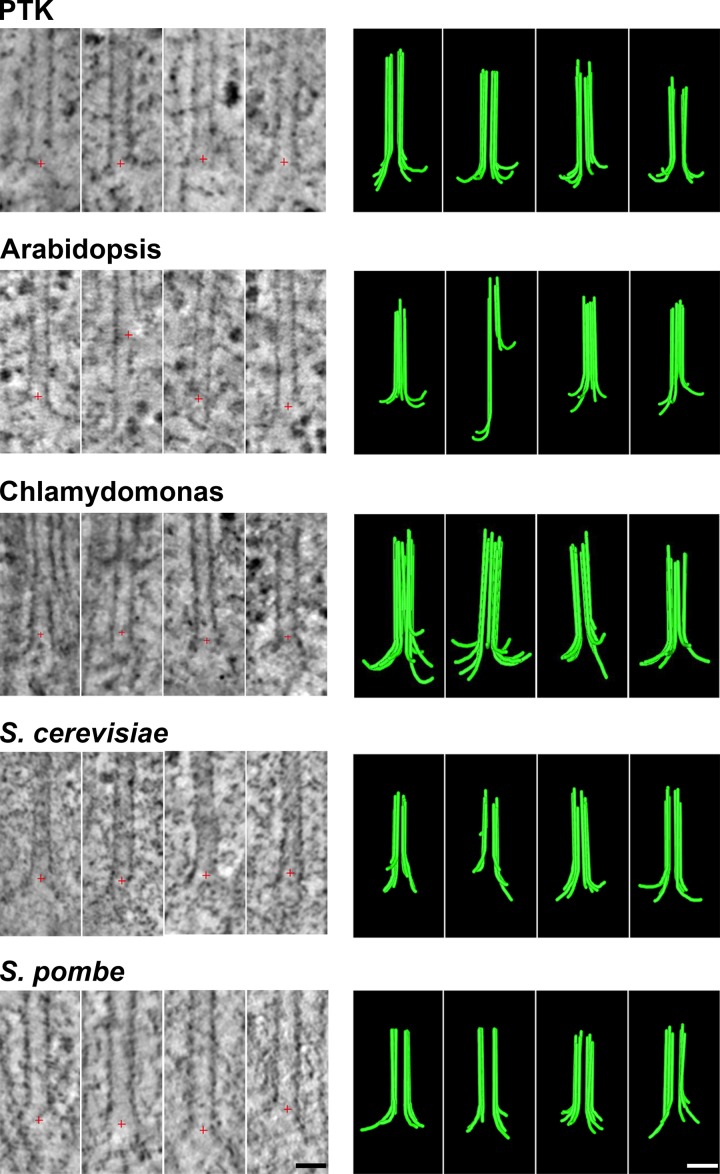
Figure 2.
Images and models of MTs growing in vivo. For each of five species names, the left column displays tomographic slices that contain the MT axis and show one or more PFs flaring out from the MT wall. Red crosses mark the origin of the coordinate system used for rotational sampling of the PFs. The right column displays models of these same MT ends showing traces of all the PFs detected by rotational sampling of the MT end as in Fig. 1 and Videos 1, 2, 3, 4, and 5. Bars, 25 nm.

