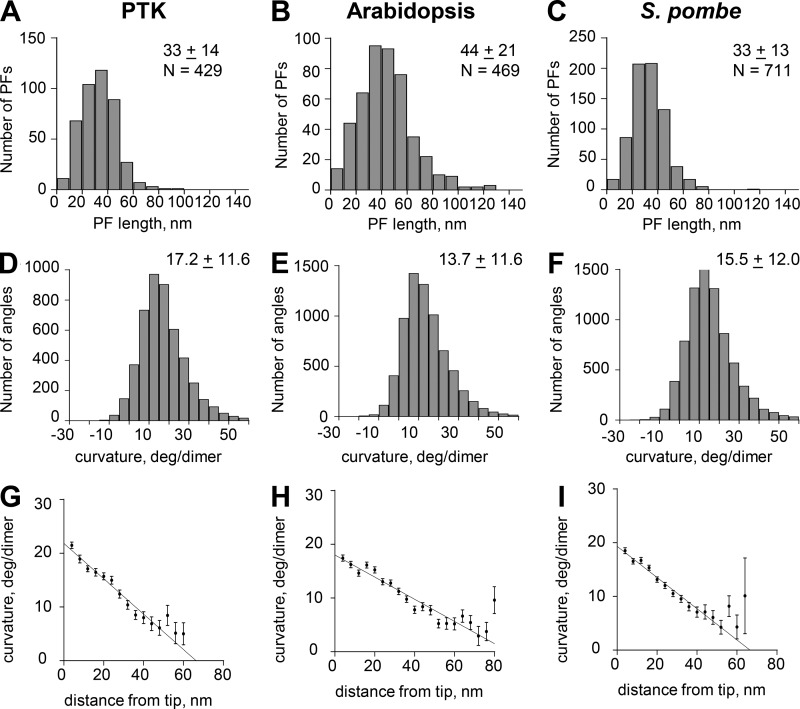
Figure 3.
Graphs depicting aspects of PF shape from three of the species studied. (A–C) Distributions of lengths for PFs from the species indicated. N, numbers of PFs traced. Other values are mean lengths ± SD. (D–F) Distributions of angles between consecutive line segments that connect adjacent points along all tracings for all PFs of each species shown. N, numbers of angles. Other values are means ± SD. (G–I) Distributions of mean angles between consecutive line segments plotted as functions of distance from the PF tip for each of the species studied. Error bars are SEM.

