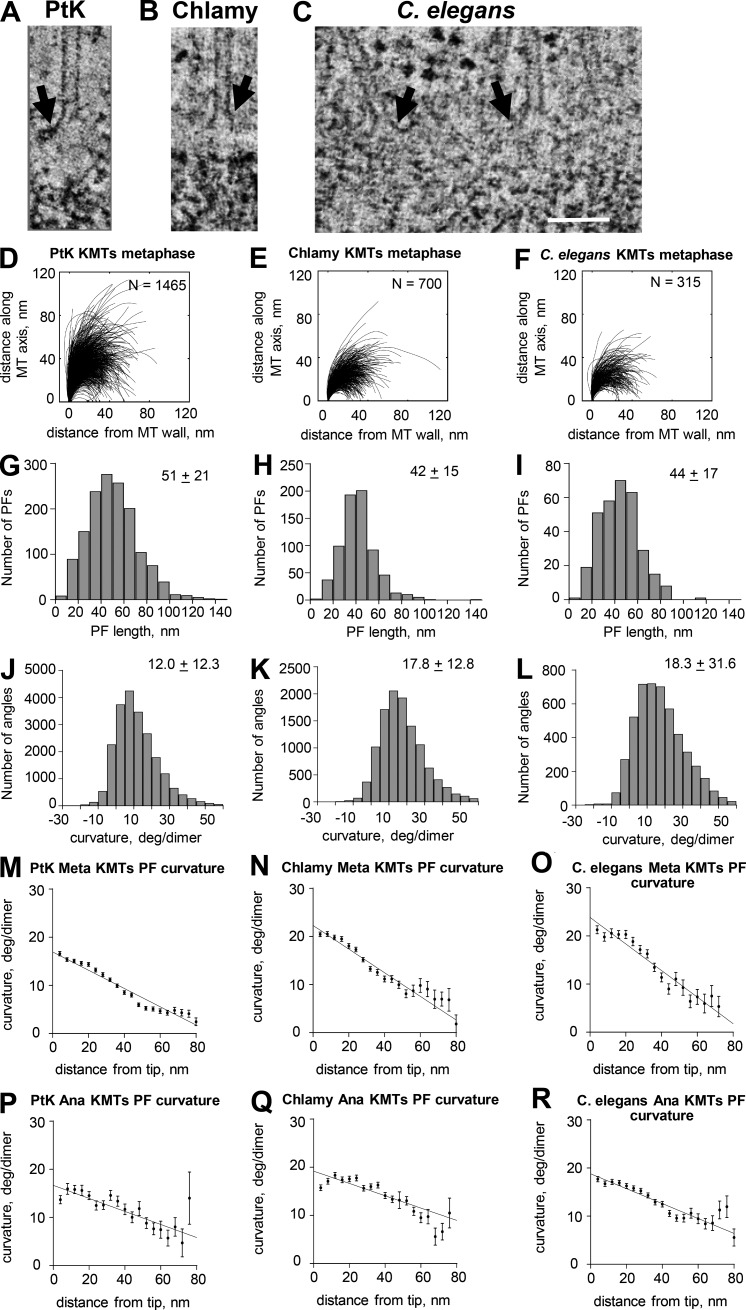
Figure 4.
Pictures and graphs describing the plus ends of metaphase KMTs. (A–C) Slices from tomograms of the plus ends of metaphase KMTs from the three species named. Arrows indicate flaring PFs. Bar, 100 nm. (D–F) Smoothed traces of PFs drawn on metaphase KMTs from each species. N, numbers traced. (G–I) Distributions of PF lengths. (J–L) Distributions of angles between adjacent line segments along PFs. Numbers are means ± SD. (M–O) Means and SEM of angles between adjacent segments along PFs plotted as a function of distance from the PF tips. (P–R) Similar graphs for PF from anaphase KMTs from the same species. Chlamy, Chlamydomonas.

