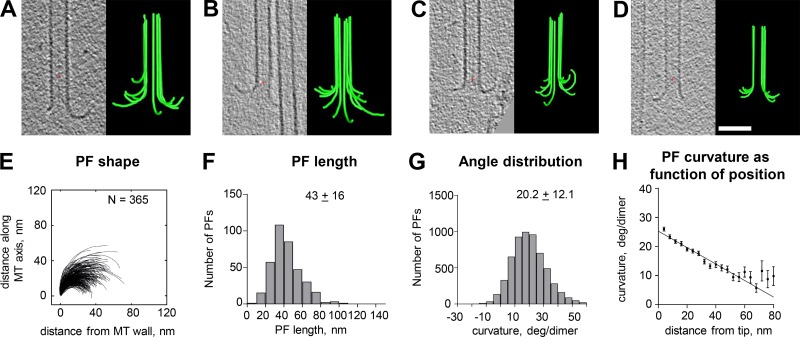
Figure 7.
Shapes of plus ends of MTs shortening in vitro. (A–D) Tomographic slices and models showing flaring PFs of MTs frozen ∼20 s after isothermal dilution. Red crosses mark the origins of the coordinate systems used. Bar, 50 nm. (E) Traces of PFs on shortening MTs. (F–H) Graphs showing distributions of lengths, angles, and angles as a function of distance from the PF tips. Numbers and bars are as in Fig. 5. N, numbers traced. Error bars show SEM.

