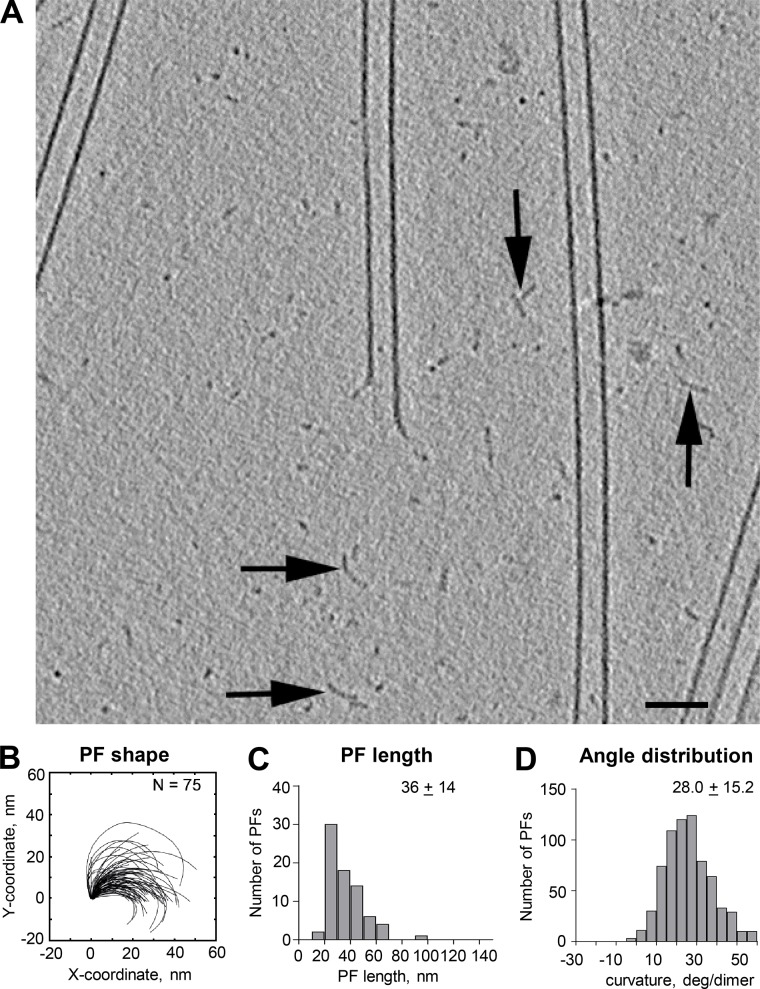
Figure 8.
Oligomers formed during tubulin polymerization. (A) 20-nm slice from a cryotomogram of an MT elongating in 20 µM tubulin for 6 min before plunge freezing. A large enough area of background is shown to reveal structures that we interpret as oligomers of tubulin (arrows) lying between the elongating MTs. Bar, 50 nm. (B–D) Tracings of these structures and distributions of their lengths and curvatures. N, numbers traced.

