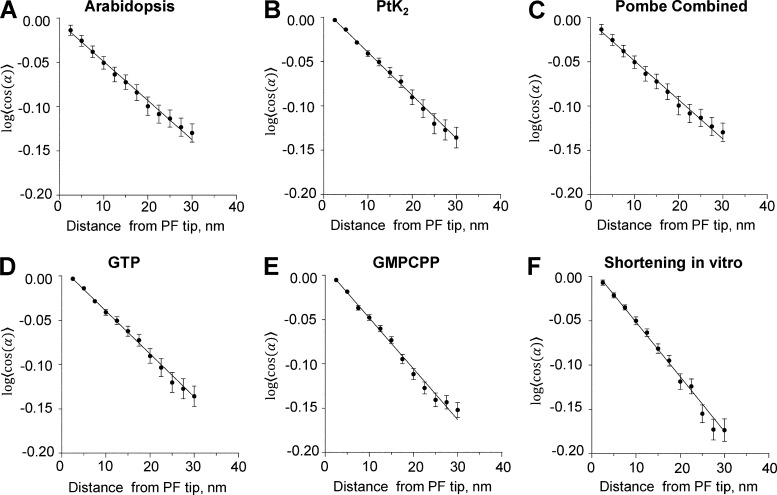
Figure 9.
Data describing PF flexibility. (A–F) Plots of the logarithms of the cosines of mean differences between each measured angle between adjacent line segments and the means of all angles at that distance from the PF tip for each species listed. Error bars are SEM. Assuming thermal equilibrium, these data yield measures of persistence lengths as stated in Table 4. Pombe, S. pombe.

