Figure 10.
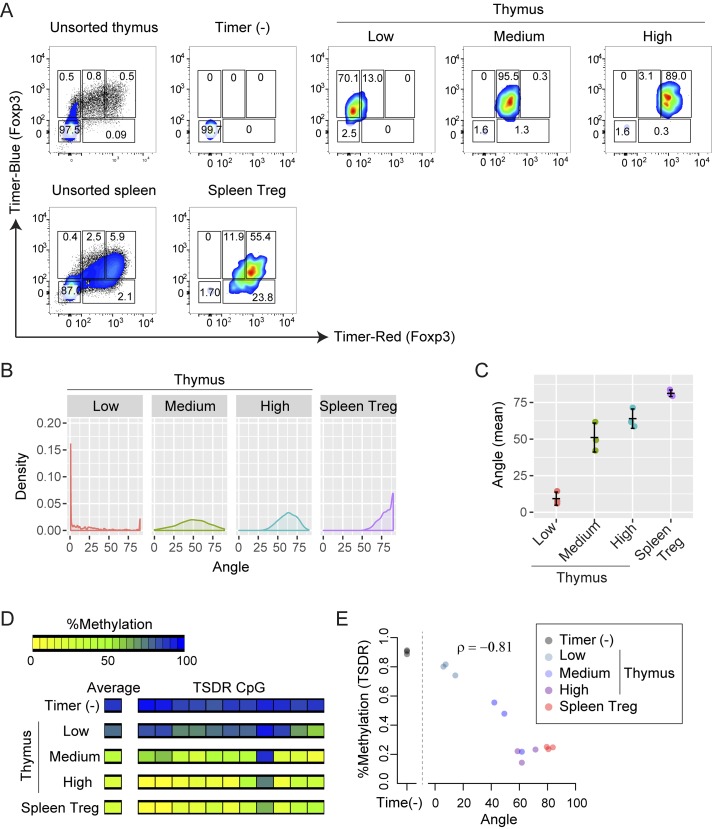
Foxp3-Tockyreveals in vivo dynamics of demethylation of the Foxp3 gene. (A–E) Thymic cells or splenic Treg cells were sorted according to increasing Tocky time (i.e., Timer Angle) in blue+ cells. (A–C) Flow cytometry plots of blue versus red fluorescence (A), Timer Angle density plots (B), or mean Timer Angle in the sorted T cell populations (C); n = 3. DNA was extracted for methylation analysis, and thymic samples were compared with Timer (−) and splenic Treg cell samples. (D) Heatmap showing mean TSDR methylation rates of flow-sorted T cell subsets. (E) Mean TSDR methylation rates plotted against mean Timer Angle in sorted T cell subsets (n = 3 mice for each subset). Spearman’s correlation coefficient is shown. Data were combined from two experiments.

