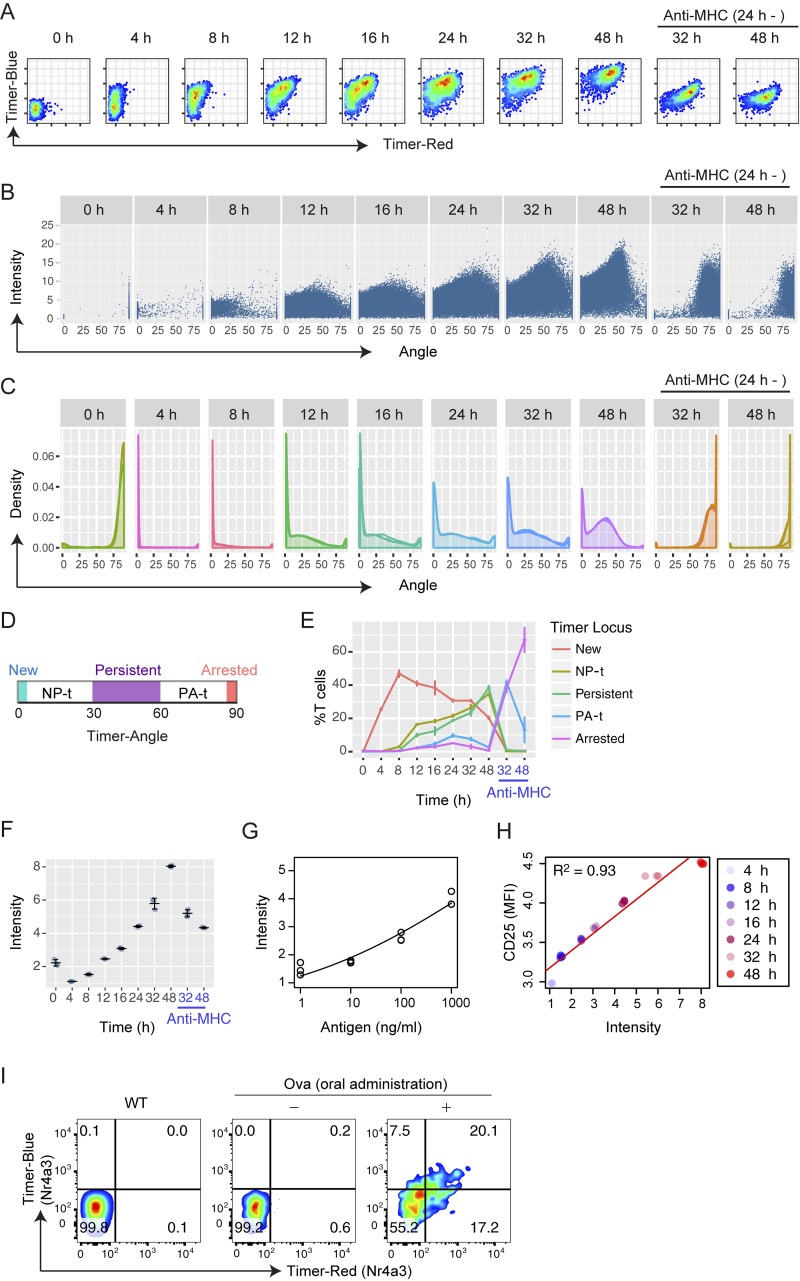
Figure 3.
Nr4a3-Tocky reveals the time domain of TCR signal–triggered activation and differentiation events. (A) Flow cytometric analysis of blue and red Timer raw fluorescence in antigen-stimulated OT-II Nr4a3-Tocky T cells. T cells were stimulated for the indicated time points with 1 µM Ova peptide. In some cultures, anti–MHC II antibodies were added at 24 h to terminate TCR signaling. (B) Trigonometric-transformed data from A. Individual cells are plotted against Timer Angle and Timer Intensity. (C) Density plot of Timer Angle from the transformed data. (D) The designation of the five Timer loci by Timer Angle θ as follows: New (θ = 0°), NP-t (0° < θ < 30°), Persistent (30° ≤ θ < 60°), PA-t (60° ≤ θ < 90°), and Arrested (θ = 90°). (E) Timer Locus analysis to show the frequency of cells within the five Timer loci defined in C. (F) Summary of Timer Intensity in the cultures from A over time. (G) Dose–response curve of Timer Intensity on stimulation with titrated doses of Ova peptide (antigen). OT-II Nr4a3-Tocky T cells were stimulated for 22 h in the presence of 1, 10, 100, or 1,000 nM Ova peptide and APCs. Data were fitted to a dose–response curve with a statistical significance by a lack-of-fit test (P = 0.014). (H) Scatter plot of Timer Intensity versus cell surface CD25 expression. Linear regression analysis showed a strong correlation (R2 = 0.93). See legend for sample identities. (I) CD4+ T cells from OT-II TCR transgenic Nr4a3-Tocky mice were adoptively transferred in to CD45.1 congenic mice, which were fed Ova or control for 3 d. CD45.2+CD45.1+CD4+ OT-II Nr4a3-Tocky T cells within mesenteric lymph nodes were analyzed for Timer expression. Error bars represent mean ± SD; n = 3 culture triplicates. Data are representative of at least two independent experiments.

