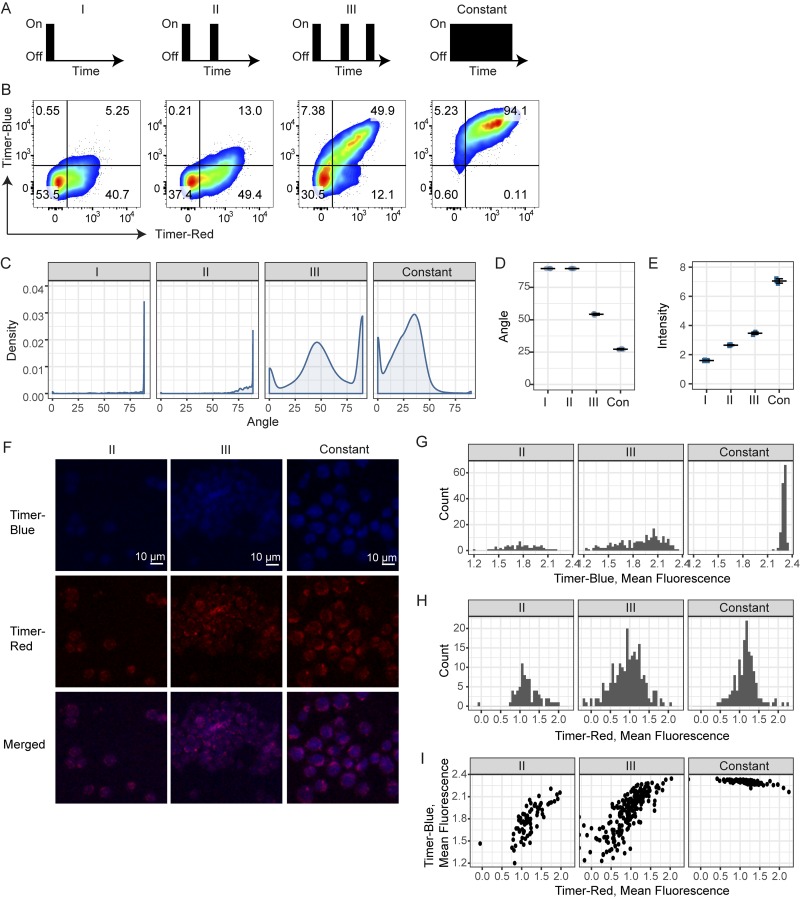
Figure 4.
Nr4a3-Tocky captures the frequency domain of TCR signaling. (A–I) T cells from OTII Nr4a3-Tocky mice were cultured with T cell–depleted splenocytes. (A) T cells were stimulated with 1 µM Ova as follows: 4-h stimulation, then rested for 48 h (I); 4-h stimulation, 20-h rest, 4-h stimulation, and 24-h rest (II); 4-h stimulation, 20-h rest, 4-h stimulation, 20-h rest, and 4-h stimulation (III); or 2-d constant (Con) stimulation. During resting stages, cells were incubated with 100 U/ml recombinant IL-2 and 20 µg/ml anti–MHC II and washed before and after stimulations. (B) Cells were then harvested and CD4+ OTII T cells analyzed for Timer–blue versus Timer–red fluorescence expression by flow cytometry. (C) Displayed are the Timer Angle distributions for the four culture conditions. (D and E) Shown are the mean Timer Angle (D) or Timer Intensity (E) within the four different cultures. Error bars represent mean ± SD; n = 3 culture triplicates. (F) Confocal microscopy analysis of OTII Nr4a3-Tocky stimulated with various frequencies. The same cell samples used in A–D were analyzed by confocal microscopy. Bars, 10 µm. (G and H) Histogram showing the mean fluorescence intensity of Timer–blue (G) or Timer–red fluorescence (H) in single cells by microscopic image analysis. (I) 2D plots of the mean fluorescence intensities of Timer–blue and Timer–red fluorescence in single cells by microscopic image analysis. Cells were identified as regions of interest, and mean fluorescence intensities were measured and logged. See Fig. S2 and Materials and methods for details.

