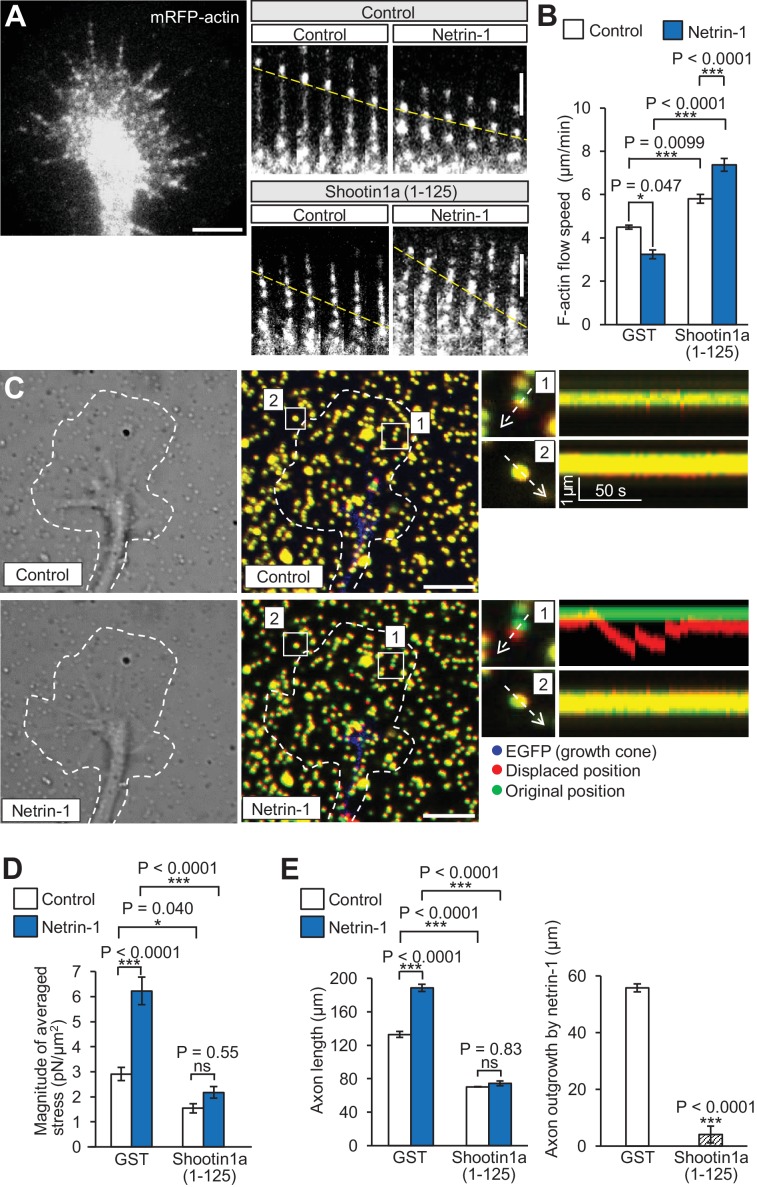
Figure 6. Shootin1a–L1-CAM interaction mediates netrin-1–induced F-actin adhesion coupling and mechanoresponse for axon outgrowth.
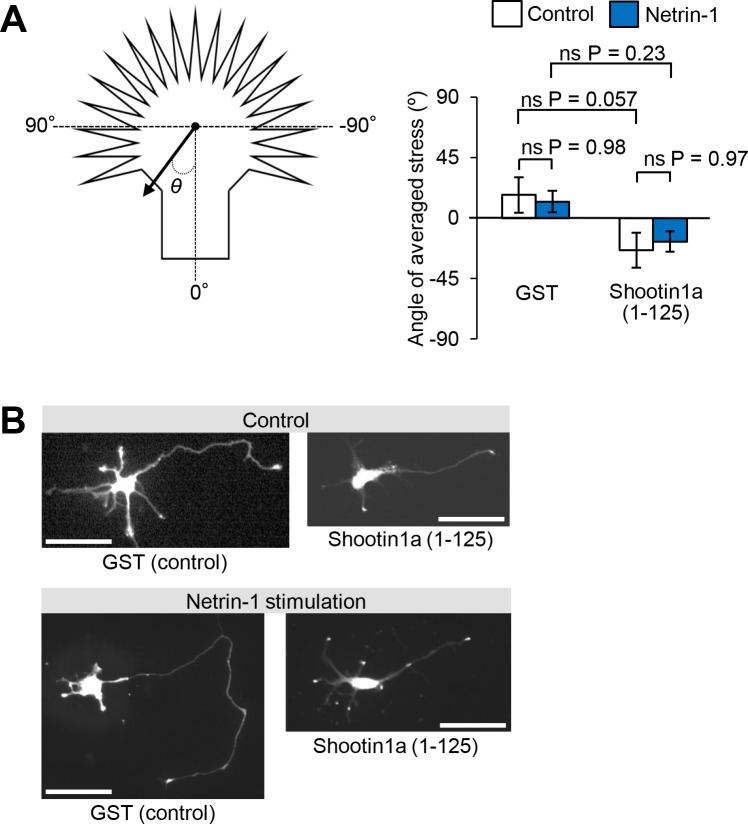
(A) Fluorescent feature images of mRFP-actin at axonal growth cones overexpressing myc-GST (control) or myc-shootin1a (1-125) in the absence (control) or presence of 4.4 nM netrin-1 (see Video 2). Kymographs of the fluorescent features of mRFP-actin in filopodia at 5 s intervals are shown (F-actin flows are indicated by dashed yellow lines). (B) F-actin retrograde flow speed measured from the kymograph analysis in A; 120 fluorescent features (47 growth cones) were analyzed. One-way ANOVA with Tukey’s post hoc test was used. (C) DIC and fluorescence images (left panel) showing an axonal growth cone of a DIV2 neuron overexpressing EGFP and cultured on L1-CAM–coated polyacrylamide gel with embedded 200 nm fluorescent beads. The panels show representative images from time-lapse series taken every 3 s for 150 s before (control) and 60 min after netrin-1 (4.4 nM) stimulation (see Video 3). The original and displaced positions of the beads in the gel are indicated by green and red colors, respectively. Dashed lines indicate the boundary of the growth cone. The kymographs (right panel) along the axis of bead displacement (white dashed arrows) at the indicated areas 1 and 2 of the growth cone show movement of beads recorded every 3 s. The bead in area two is a reference bead. (D) Analyses of the magnitude of the traction forces under axonal growth cones overexpressing myc-GST (control) or myc-shootin1a (1-125) before (control) or after netrin-1 stimulation (see Figure 6—figure supplement 1A for the direction of the traction forces, n = 14 growth cones). One-way ANOVA with Tukey’s post hoc test was performed. (E) Three hours after plating, hippocampal neurons overexpressing myc-GST (control) or myc-shootin1a (1-125) were incubated with BSA (control) or 4.4 nM netrin-1 for 40 hr, and then immunolabeled by anti-myc antibody (see Figure 6—figure supplement 1B). Axon length was then analyzed (n = 909 neurons). One-way ANOVA with Schaffer’s post hoc test was performed in the left graph, while an unpaired Student’s t-test was used in the right graph. Data represent means ± SEM; ***p<0.01; *p<0.05; ns, not significant. Bars: 5 μm (in the kymographs of A, 2 μm).


