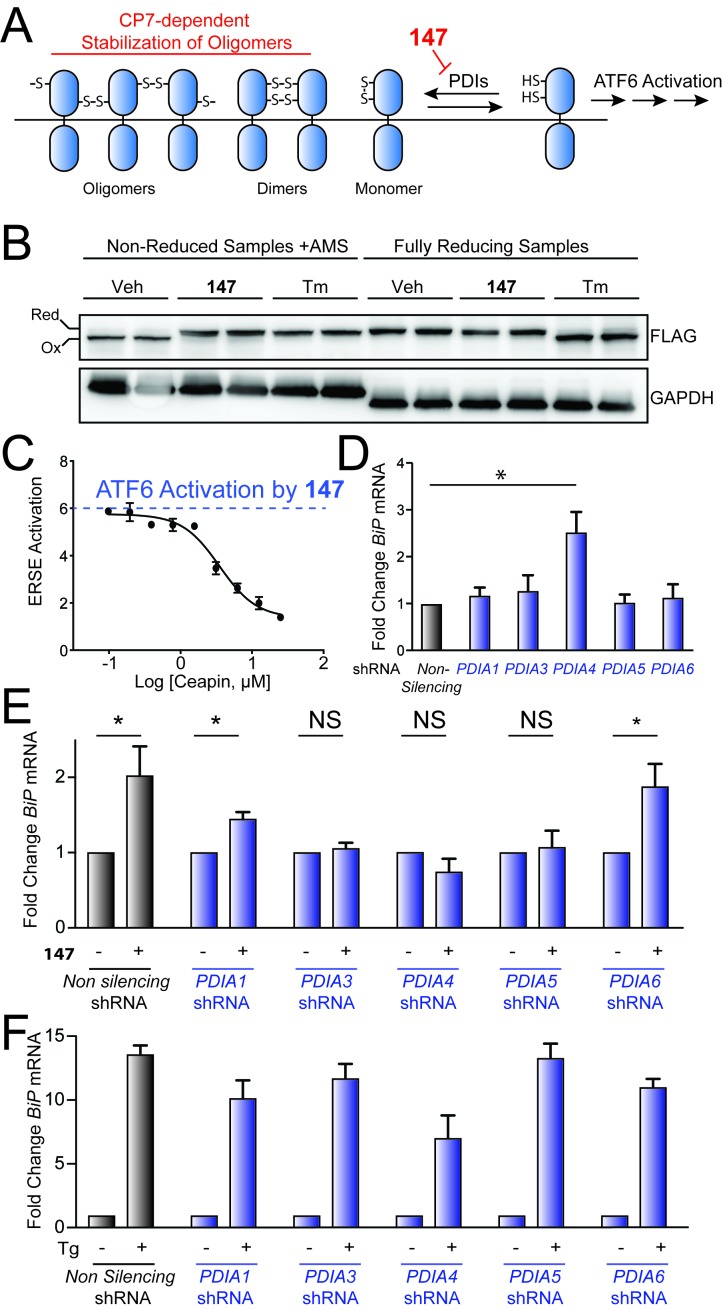
Figure 5. Genetic depletion of select PDIs alters 147-dependent ATF6 activation.
(A) Mechanistic model of 147-dependent ATF6 activation, as described in the main text. The red component of the figure shows how pharmacologic modulation of ATF6 by 147 or CP7 influences ATF6 activity. (B) Immunoblot showing lysates prepared from HeLa cells stably expressing FLAG-tagged ATF6 treated for 6 hr with 147 (10 µM) or tunicamycin (Tm; 1 mg/mL). Lysates were separated by non-reducing or reducing SDS-PAGE prior to immunoblotting. The bands representing oxidized and reduced ATF6 are indicated. Note the increased ATF6 migration observed in reducing gels for Tm-treated cells, reflecting the inhibited N-linked glycosylation of ATF6 in these samples. (C) Graph showing relative activation of the ERSE.Fluc ATF6 reporter in HEK293T cells co-treated for 18 hr with 147 (10 µM) and increasing concentrations of CP7, as indicated. Error bars show SEM for three technical replicates. (D) Bar graph showing BiP expression in HEK293T cells stably expressing non-silencing, PDIA1, PDIA3, PDIA4, PDIA5, or PDIA6 shRNA, as indicated. BiP expression in the PDI-depleted cells is shown relative to cells expressing non-silencing shRNA. Error bars show SEM for 3 independent experiments. *indicates p<0.05. (E) Bar graph showing BiP expression in HEK293T cells expressing non-silencing, PDIA1, PDIA3, PDIA4, PDIA5, or PDIA6 shRNA treated for 6 hr with or without 147 (10 µM). BiP expression levels for samples treated with 147 are normalized to the corresponding vehicle-treated controls. Un-normalized data are shown in Figure 5—figure supplement 1B. Error bars show SEM for 3 independent experiments. *indicates p<0.05. (F) Bar graph showing BiP expression in HEK293T cells expressing non-silencing, PDIA1, PDIA3, PDIA4, PDIA5, or PDIA6 shRNA treated for 6 hr with or without thapsigargin (Tg; 0.5 µM). BiP expression levels for samples treated with Tg are normalized to the corresponding vehicle-treated controls. Un-normalized data are shown in Figure 5—figure supplement 1C Error bars show SEM for 3 independent experiments.
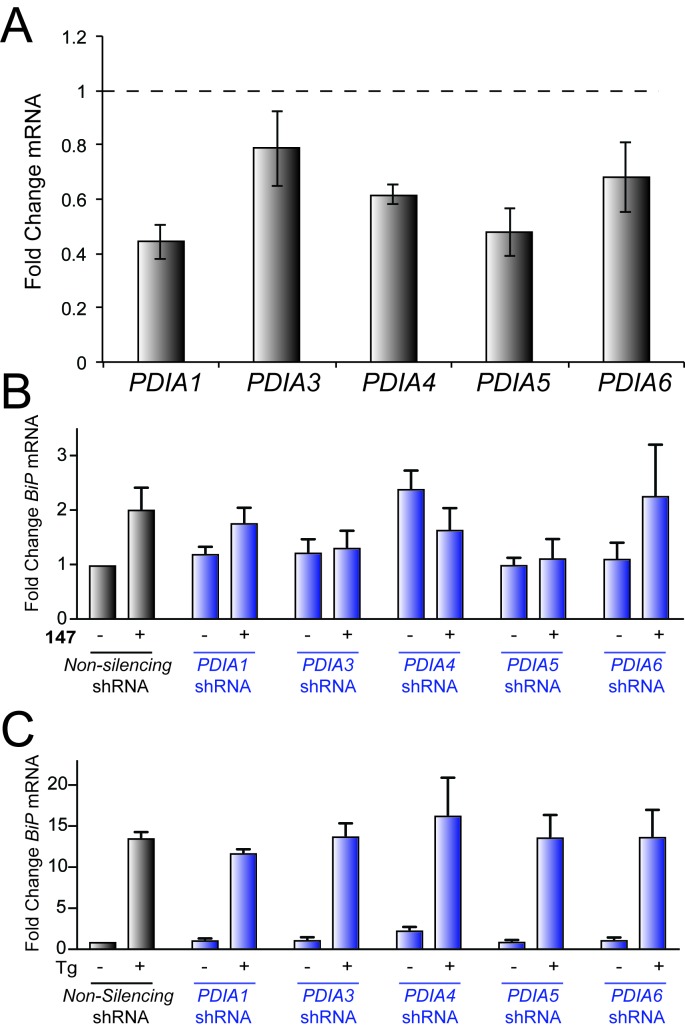
Figure 5—figure supplement 1. Genetic depletion of select PDIs disrupts 147-dependent ATF6 activation.
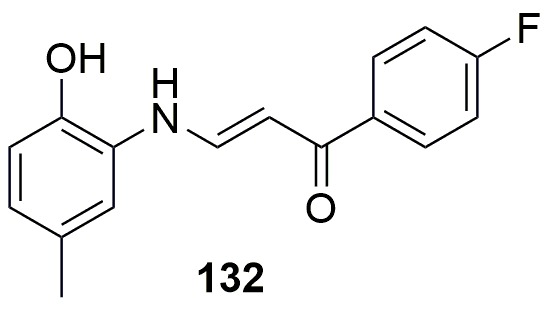
Figure 5—figure supplement 2. Structure of 132.


