. 2018 Jul 4;7:e36221. doi: 10.7554/eLife.36221

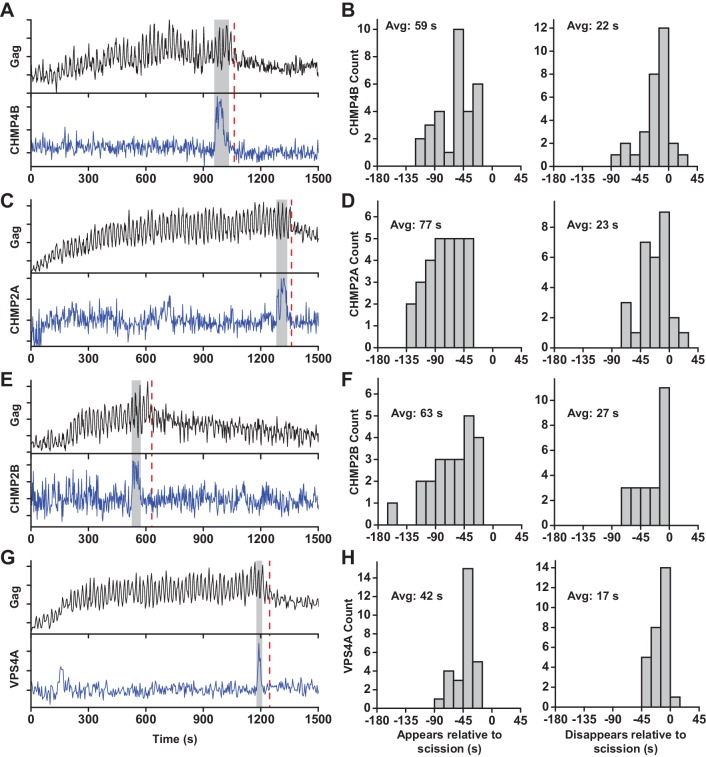
Figure 1. ESCRT-IIIs and VPS4A transiently recruited prior to scission.

(A) Example trace of Gag-pHluorin assembling into single VLP while the pCO2 in the imaging media was repeatedly switched between 0% and 10% every 10 s. Moment of scission is indicated by red dashed line. CHMP4B-mCherry was temporarily recruited (indicated by grey zone) to the site of VLP assembly following the loss of pH modulation sensitivity. (B) Histograms of appearance and disappearance of CHMP4B prior to scission. (C-H) Example traces and histograms of appearance and disappearance, relative to scission of the VLP, for mCherry-CHMP2A (C and D), mCherry-CHMP2B (E and F) and mCherry-VPS4A (G and H).

Figure 1.

Figure 1—figure supplement 1. Flow chamber configuration for ESCRT-III assisted membrane scission studies.
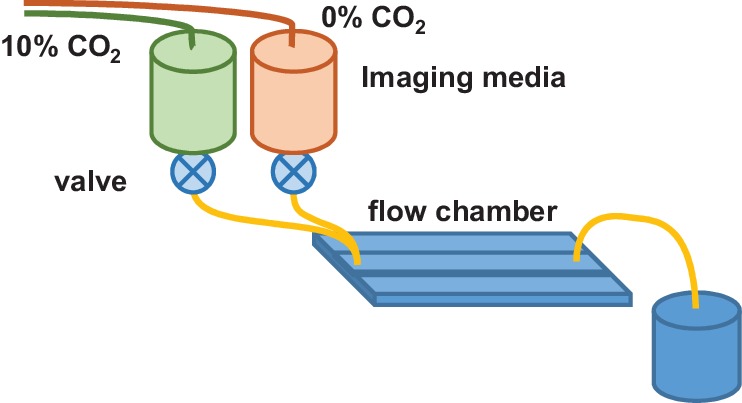
Figure 1—figure supplement 1.

Imaging media in reservoirs was preequilibrated with gas containing 0 and 10% CO2 (balanced with air). During assembly of single HIV particles in cells, the imaging media was modulated between reservoirs, enabling detection of scission of the VLP from the cell.
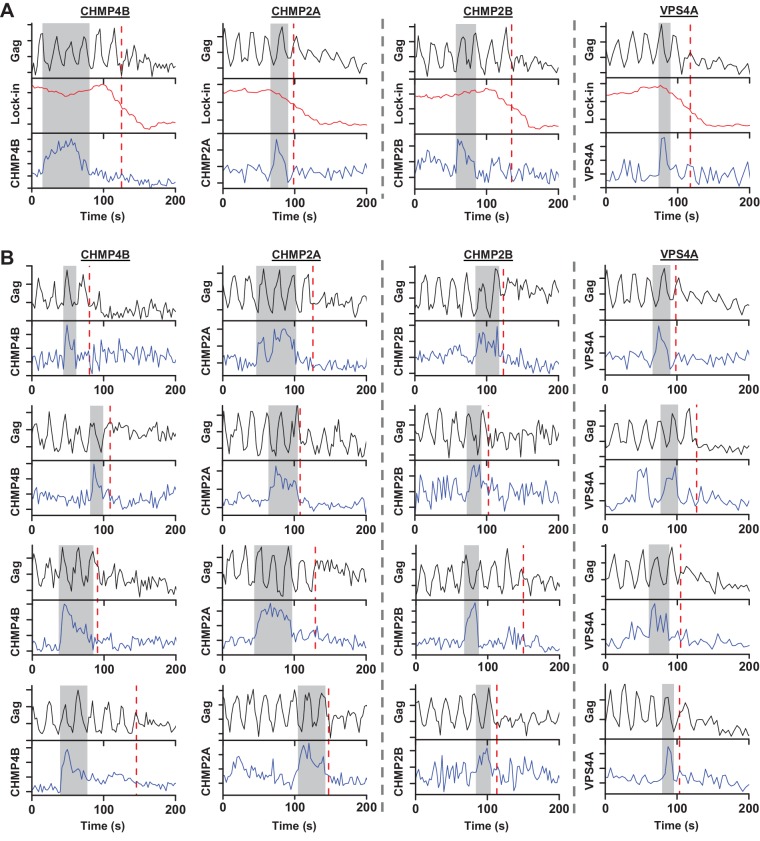
Figure 1—figure supplement 2. Example traces of scission relative to recruitment of ESCRT-III or VPS4A.

Figure 1—figure supplement 2.

(A) Gag-pHluorin was observed as pCO2 was cycled between 0 and 10% every 10 s. VLP scission time (red dashed line) was characterized by half drop in lock-in signal. mCherry-CHMP4B, mCherry-CHMP2A, mCherry-CHMP2B and mCherry-VPS4A recruitment (left to right panels, recruitment highlighted in grey) were simultaneously monitored during Gag assembly. (B) Additional traces of VLP scission during recruitment of mCherry-CHMP4B, mCherry-CHMP2A, mCherry-CHMP2B, and mCherry-VPS4A (left to right columns).
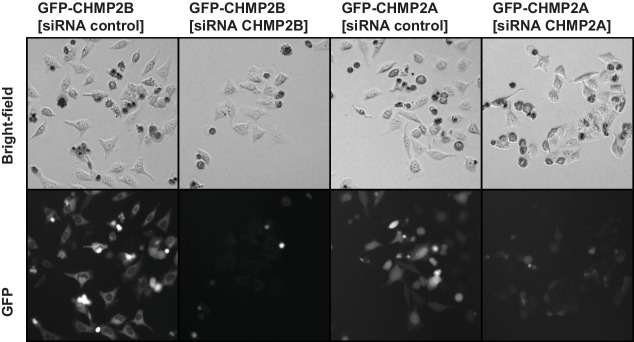
Figure 1—figure supplement 3. Knockdown of CHMP2A or CHMP2B by siRNA.

Figure 1—figure supplement 3.

HeLa cell lines stably expressing either mEGFP-CHMP2A or mEGFP-CHMP2B were transfected with siRNA to either CHMP2A or CHMP2B or a control siRNA. 48 hr after transfection, presence of tagged ESCRT was significantly reduced and resulted in fewer cells, presumably because of decreased cell division.
Figure 1—figure supplement 4. CHMP4B was recruited prior to VPS4A.
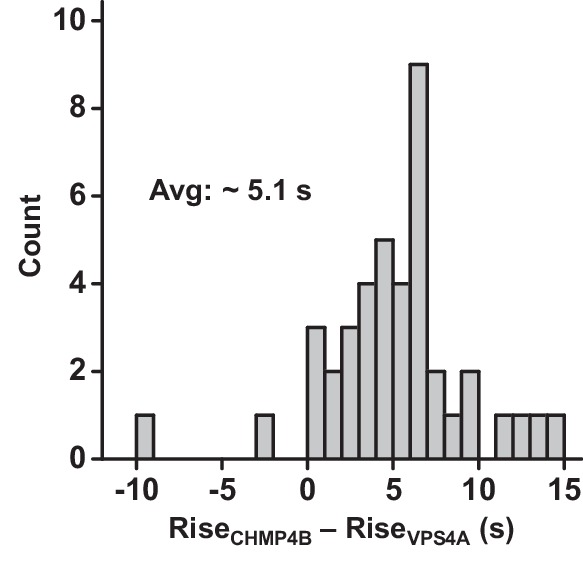
Figure 1—figure supplement 4.

The times associated with the rising fluorescence edge of VPS4A and CHMP4B were compared relative to each other. CHMP4B appeared on average 5.1 s prior to VPS4A.
Figure 1—video 1. Gag-pHluorin (left side of video) and mCherry-CHMP4B (right side) were imaged while the CO2 in the media was modulated between 0 and 10% every 10 s.
Download video file (62.2MB, mp4)
DOI: 10.7554/eLife.36221.008
Figure 1—video 2. Example of individual puncta of Gag-pHluorin assembly (left side, CO2 switching every 10 s) with mCherry-CHMP4B (right side) recruitment.
Download video file (446.8KB, mp4)
DOI: 10.7554/eLife.36221.009
CHMP4B begins to appear at 13:29 min.
Figure 1—video 3. Gag-pHluorin (top of video) and mCherry-VPS4A (bottom) were imaged while the CO2 in the media was modulated between 0 and 10% every 10 s.
Download video file (35.1MB, mp4)
DOI: 10.7554/eLife.36221.010
Figure 1—video 4. Example of individual puncta of Gag-pHluorin assembly (left side, CO2 switching every 10 s) with mCherry-VPS4A (right side) recruitment.
Download video file (360.3KB, mp4)
DOI: 10.7554/eLife.36221.011
VPS4A begins to appear at 20:49 min.