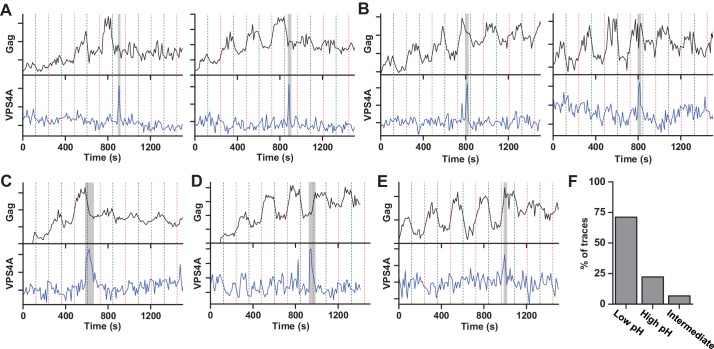
Figure 2. Scission more likely at lower cytoplasmic pH.
(A) Example traces of Gag-pHluorin assembly while pCO2 was switched every 120 s between 0% (red dashed line, greater fluorescence emission) and 10% (black dashed line, lower fluorescence emission). In these traces the fluorescence intensity became fixed in the low pH state (10% pCO2) after reaching an assembly plateau. VPS4A appeared and disappeared during the first low pH state. (B) Examples in which fluorescence intensity became fixed in the high pH state (0% pCO2). VPS4A appeared and disappeared during the first trapped high pH state. (C) Example in which fluorescence became fixed in low pH state. VPS4A disappeared during the first trapped low pH state, but appeared during the previous high pH state. (D) Example in which fluorescence became fixed in high pH state. VPS4A disappeared during the first trapped high pH state, but appeared during the previous low pH state. (E) Example trace in which fluorescence intensity because fixed in an intermediate state. (F) Bar graph of cytoplasmic pH condition in which scission occurs (N = 45). Scission is ~3-fold more likely at low pH (10% pCO2) compared to high pH (0% pCO2) condition. A small percentage of VLPs were trapped in an intermediate state.

