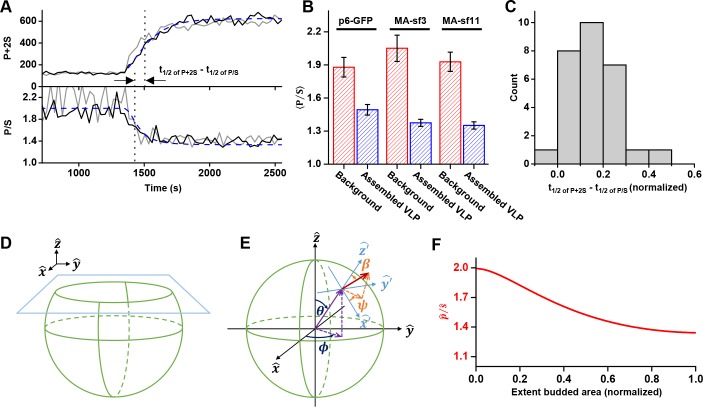
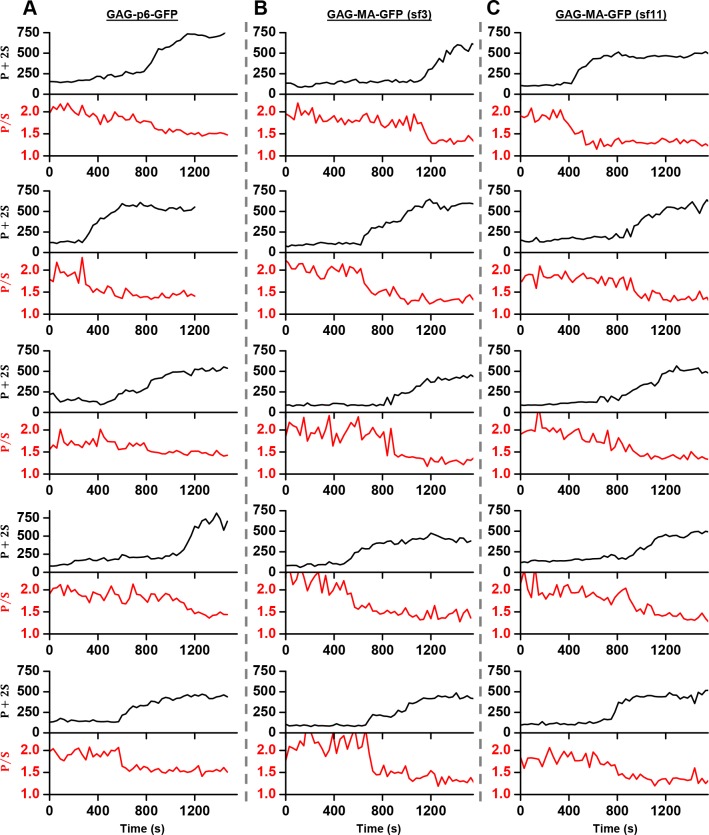
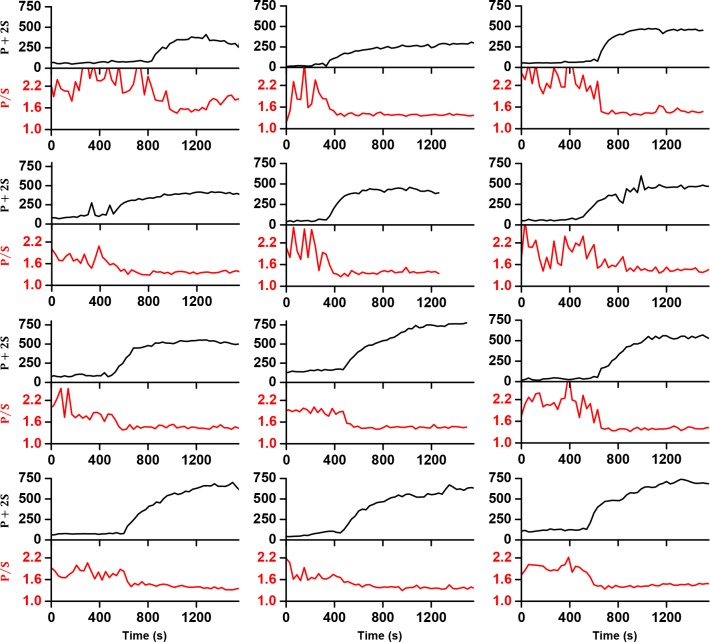
Figure 4. Structural changes in VLPs throughout Gag accumulation.
(A) Example traces of wild-type Gag-GFP (black line, sf3 in Matrix of Gag) and Gag-∆p6 (grey line, missing ESCRT-I recruiting p6 domain) assembling into single VLPs. Images were collected every 30 s with excitation illumination polarized either perpendicular () or parallel () to the glass surface. Total Gag characterized by P+2S (top) and relative average dipole orientation by P/S (bottom). P+2S from wild-type Gag was fit to an exponential and used to predict an expected P/S (blue dashed line) assuming membrane bending throughout assembly. (B) Comparison of average P/S from all traces before VLP assembly (membrane background) and after VLP assembly (plateau region) for three different tagged versions of wild-type Gag. p6-GFP (N = 8), MA-sf3 (N = 9), and MA-sf11 (N = 7). Error bars represent s.d. (C) To compare the evolution of VLP structure to the assembly of Gag the time for each assembly trace was normalized from 0 (beginning of Gag assembly) to 1 (end of Gag assembly). A normalized time difference for each trace between Gag half assembly [½ (P+2S)max] and the dipole half drop [½ (P/S)max] was found and all normalized differences were compiled into a histogram. (D) Illustration of sphere budding from flat membrane. (E) Illustration of coordinate system with θ and ϕ representing position on the sphere and β and ψ representing orientation of excitation dipole. (F) Predicted P/S when β = 45°, background intensity is 45% of full assembly intensity, and evanescent field penetration depth is the same as the radius of the VLP.


