Figure 3.

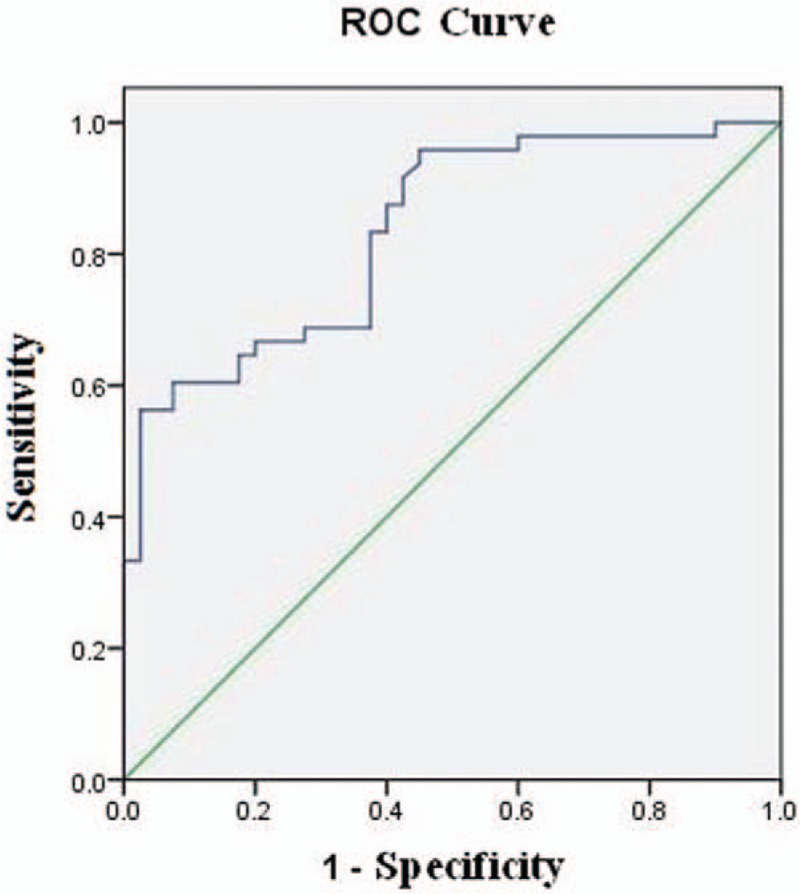
The ROC curve of the diagnosis of PN in a PET/CT mathematical prediction model (AUC = 0.835 ± 0.042). PET/CT = positron emission tomography/computed tomography, PN = pulmonary nodules, ROC = receiver operating curves.

The ROC curve of the diagnosis of PN in a PET/CT mathematical prediction model (AUC = 0.835 ± 0.042). PET/CT = positron emission tomography/computed tomography, PN = pulmonary nodules, ROC = receiver operating curves.