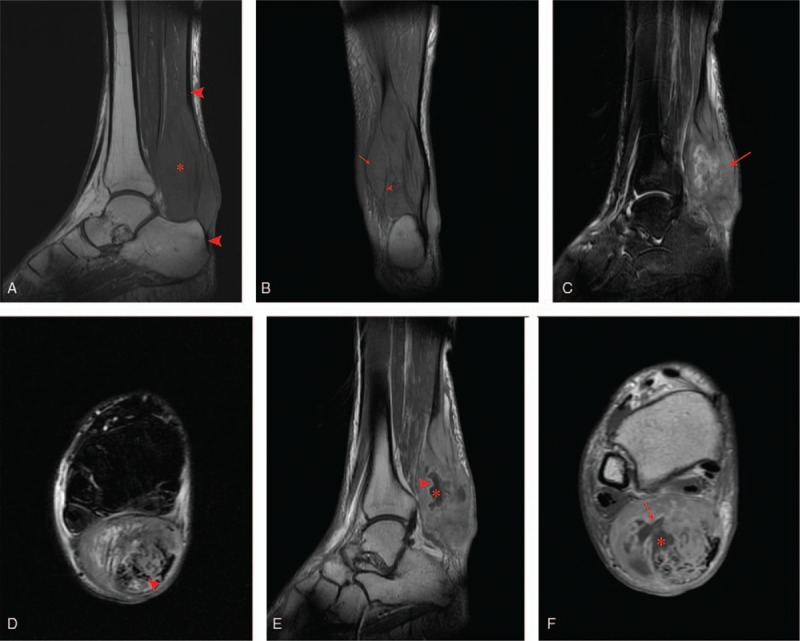
Figure 3.

(A) Sagittal T1-weighted image showing ill-defined soft tissue mass with iso-intense signal compared with adjacent muscles (asterisks), arrow heads represent the Achilles tendon. (B) Coronal proton density (PD) image showing multiple lobulated mass (red arrow) separated by septa (arrow head). (C) Sagittal (D) axial T2-wieighted fat-saturation image showing high-signal intensity mass (red arrow) with rupture Achilles tendon (arrow head). (E) Sagittal (F) axial T1-weighted image after contrast (gadolinium) administration, showing heterogeneously enhanced high-signal intensity mass with central necrosis (asterisks) and peripheral enhancement (red arrow). PD = proton density.
