
Figure 4.
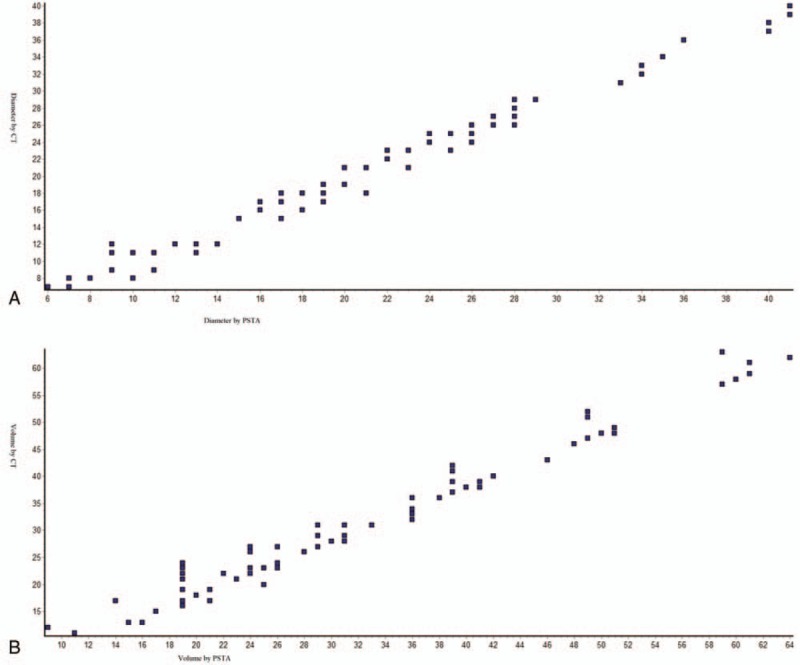
Spearmen nonparametric correlation curve between PSTA and CT scans (A) for tumor diameter, Spearman r = 0.9845 (corrected for ties, 99% confidence interval: 0.9896–0.993); (B) for tumor volume, Spearman r = 0.9706 (corrected for ties, 99% confidence interval: 0.9801–0.9866). Numbers of point = 106, n = 107 for PSTA and n = 106 for CT scan, PSTA = postsurgery tumor analysis, CT = computed tomography. Software generated figures.