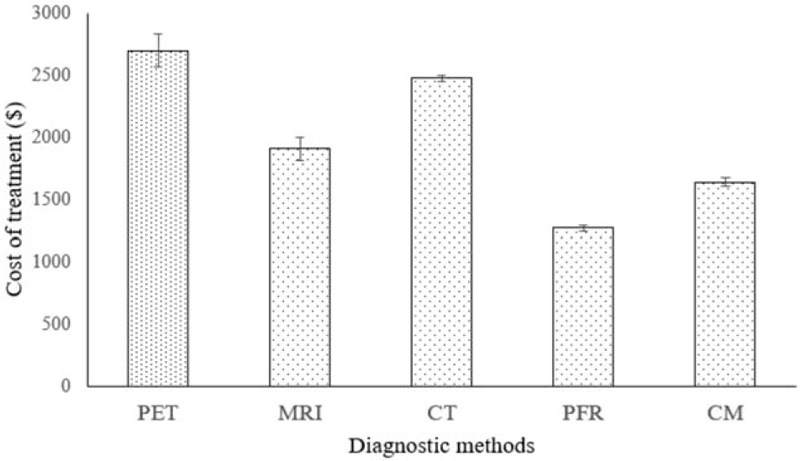
Figure 8.

Cost of diagnosis. Data were expressed as mean ± SD, n = 127 for all groups. PET scan had highest cost of diagnosis (P < .0001, q = 31.726) then after MRI scan (P < .0001, q = 12.56). CT scan had excessive cost of diagnosis than PFR (P < .0001, q = 517.09) and CM (P < .0001, q = 357.95). CT = Computed tomography, PFR = Plain-film radiography, CM = clinical manifestation, PET = positron emission tomography, MRI = magnetic resonance imaging. Wilcoxon-matched pair test following Tukey–Kramer multiple comparisons test was used for statistical analysis. P < .01 and q > 4.03 were considered as significant.
