
Figure 2.
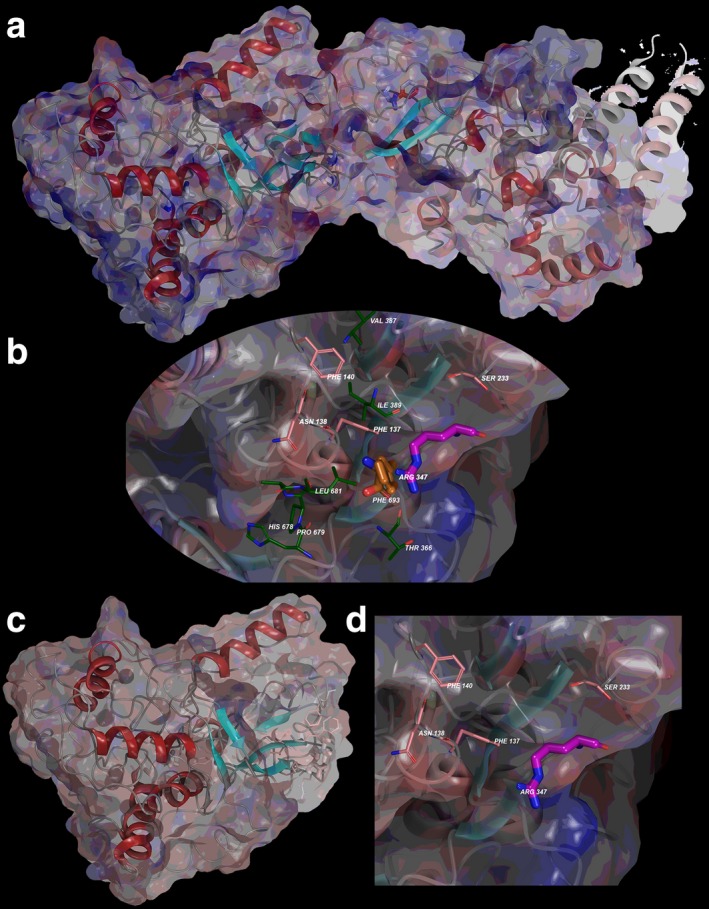
TAB2 electrostatic mapping for interaction potential. (a) Full‐length model for the entire TAB2 structure with electrostatics calculated from Poisson–Boltzman (PB) calculation overlaid onto structure. (b) Interacting residues between N‐terminus domain (1–358) and C‐terminus domain (359–693) are shown with electrostatics mapped onto. Amino acids Met1, Arg347, and Phe693 are colored as before—however, N‐term residues interacting with C‐term are colored with pink carbons and C‐term residues interacting with N‐term are colored with green carbons. (c) Deletion construct for the truncated p.R347X TAB2 model is given with electrostatics overlaid indicating increased negative charge. (d) Zoom into the region at the p.R347X site with only N‐terminus residues indicated