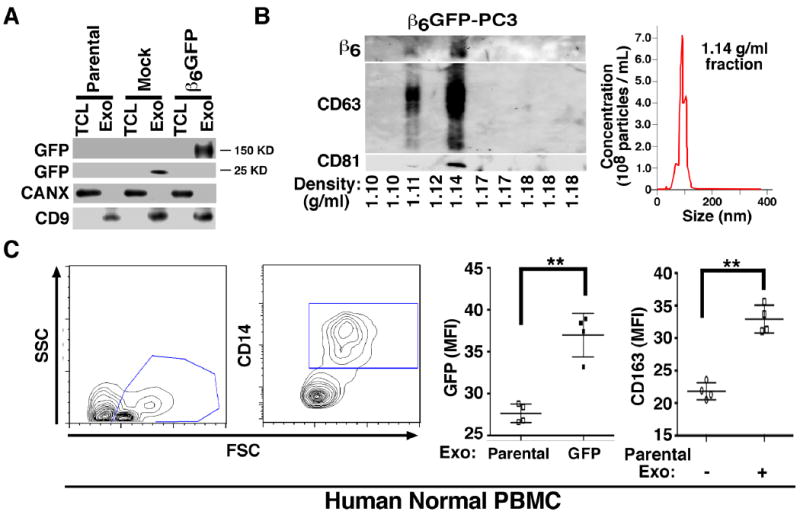
Fig. 2. Transfer of GFP-tagged αvβ6 integrin to PBMC.

(A), IB analysis for expression of GFP, CANX and exosomal marker CD9 in parental PC3, EGFP-PC3 (Mock) and β6-EGFP-PC3 derived exosome lysate (Exo) and total cell lysate (TCL). (B), Left, Iodixanol gradient analysis of β6-EGFP-PC3 derived Exo was performed as described in the Experimental Procedures. Expression of β6, CD63, and CD81 analyzed by IB is shown. The expected density range for Exo is 1.11–1.14 g/mL. Right, NTA for the fifth fraction (density 1.14 g/mL) from the iodixanol gradient of β6-EGFP-PC3 derived Exo is shown. (C), Left, human normal PBMC (2.0×10⁵ cells) incubated with 8 μg/mL of β6-EGFP-PC3 Exo for 36 hours, were immuno-stained for CD14. Flow cytometric contour plots of cells gated as CD14+ monocytes are shown. Middle, flow cytometric analysis of comparative expression of GFP measured as mean fluorescence intensity (MFI) in PBMC incubated with parental PC3 or β6-EGFP-PC3 Exo (8 μg/mL for 36 hours). Right, flow cytometric analysis of comparative expression of CD163 (M2 macrophage marker) measured as MFI in PBMC incubated with or without parental PC3 (8 μg/mL for 36 hours). Two graphs showing GFP and CD163 MFI include data from 4 biological replicates tested in 2 different experiments. **: P >0.01, student’s T test.
