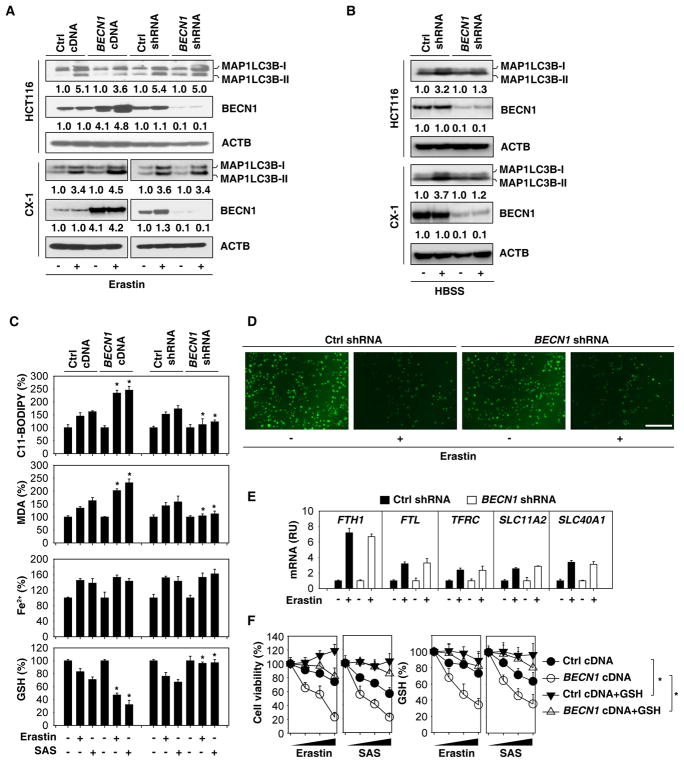
Figure 2. BECN1 promotes GSH depletion and lipid peroxidation in ferroptosis.
(A) Indicated HCT116 and CX-1 cells were treated with erastin (20 μM) for 24 h. The protein levels of MAP1LC3B were assayed. (B) The indicated HCT116 and CX-1 cells were treated with HBSS for 6 h. The protein levels of MAP1LC3B were assayed. (C) The indicated HCT116 cells were treated with erastin (20 μM) or sulfasalazine (“SAS”, 1 mM) for 24 h. The relative levels of C11-BODIPY, MDA, Fe2+, and GSH were assayed (n=3, *, P<0.05 versus control group, t test). (D) Intracellular chelatable iron in indicated HT1080 cells treated with or without erastin (5 μM, 24 h) was determined using the fluorescent indicator Phen Green SK (green). (E) Q-PCR analysis of gene expression in indicated HT1080 cells treated with or without erastin (5 μM, 24 h). RU=relative units. (F) Administration of GSH (5 mM) restored intracellular GSH level and inhibited erastin (20 μM)- or sulfasalazine (“SAS”, 1 mM)-induced cell death at 24–72 h in wild-type and BECN1-overexpressing HCT116 cells. See also Figure S3.

