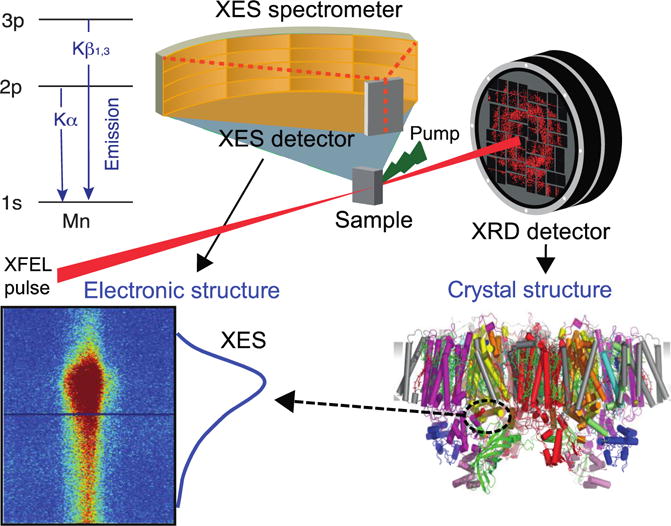
Fig. 1.

Schematic for simultaneous XRD and XES measurements using either a jet injector20 or the Drop-on-Tape (DOT)13 method giving both diffraction images and XES spectrum. This set-up utilizes a von Hamos spectrometer for XES data collection, which enables the detection of the entire Kβ1,3 spectra in an energy dispersive mode on a position sensitive 2D detector on a shot-by-shot basis. Upper left: energy diagram of Kα and Kβ1,3 transitions.
