
Fig. 2.
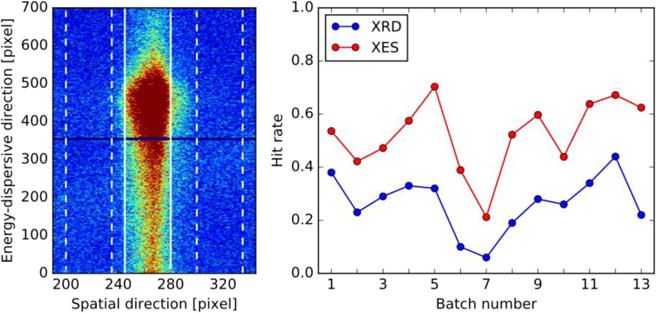
(left) Total detector image of the dark state (0-Flash, 0F) collected during experiment 1. Vertical lines indicating ROI, and vertical dashed lines indicating slices for background subtraction and comparison region for hit finder. The image is the sum of all XES images counted as hits (totally 22,606, with 177,639 detected emission photons). (right) Average hit/indexing rates of different sample batches from experiment 1, estimated using the spectroscopic hit finder (red) and indexing rates from crystallography (blue).