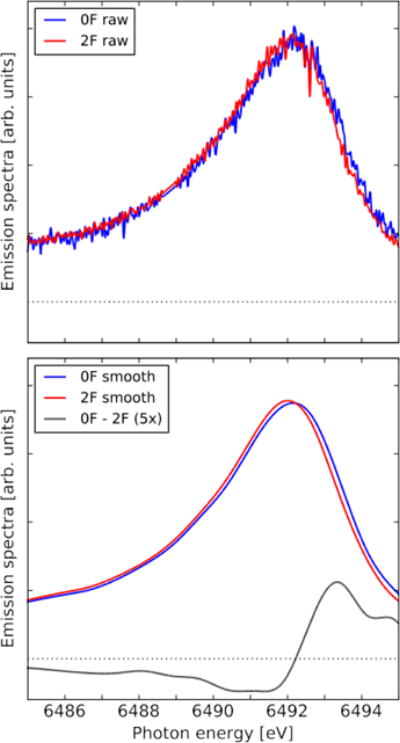
Fig. 3.

Kβ1,3 emission spectra of the 0F and 2F flash states from experiment 1, as well as the 0F-2F difference spectrum (enlarged by a factor of 5). The spectra were area normalized inside the adopted energy interval. The smoothed spectra have been constructed by first binning the raw spectra to 0.75 eV resolution and then using a cubic spline to construct smoothed spectra of 0.01 eV resolution. The 0F data contains 22,606 shots and totally 177,639 emission photons, while 2F contains 67,219 shots and 590,156 emission photons.
